
We build your analytics. You build your projects.
Our team connects your systems, builds your dashboards, and keeps them running, so every morning you know which jobs need you. Live in a week.
The teams building with Projexion


What customers typically see
Five steps. We take the first four.
-
We hook up your systems.
-
We start you on our library of dashboards and automations.
-
We tune them to how your company runs.
-
We keep it all running and add what you need next.
-
You sit back and monitor your portfolio while drinking your coffee.
A first term of twelve months, with a way out at three.
We don't do one-off project engagements. We become your BI team, and most customers keep us on long after the first term. That first term is twelve months.
Your first dashboards go live within a week. If you're not happy with what you're getting after three months, you can cancel.
200 calculations behind one score
An operations leader wanted one thing every morning: the projects that need attention. A risk flag you can trust means scoring every job on cost, schedule, and process, and that came to about 200 calculations wired together into one portfolio health score.
Projexion built the whole tree in five minutes.
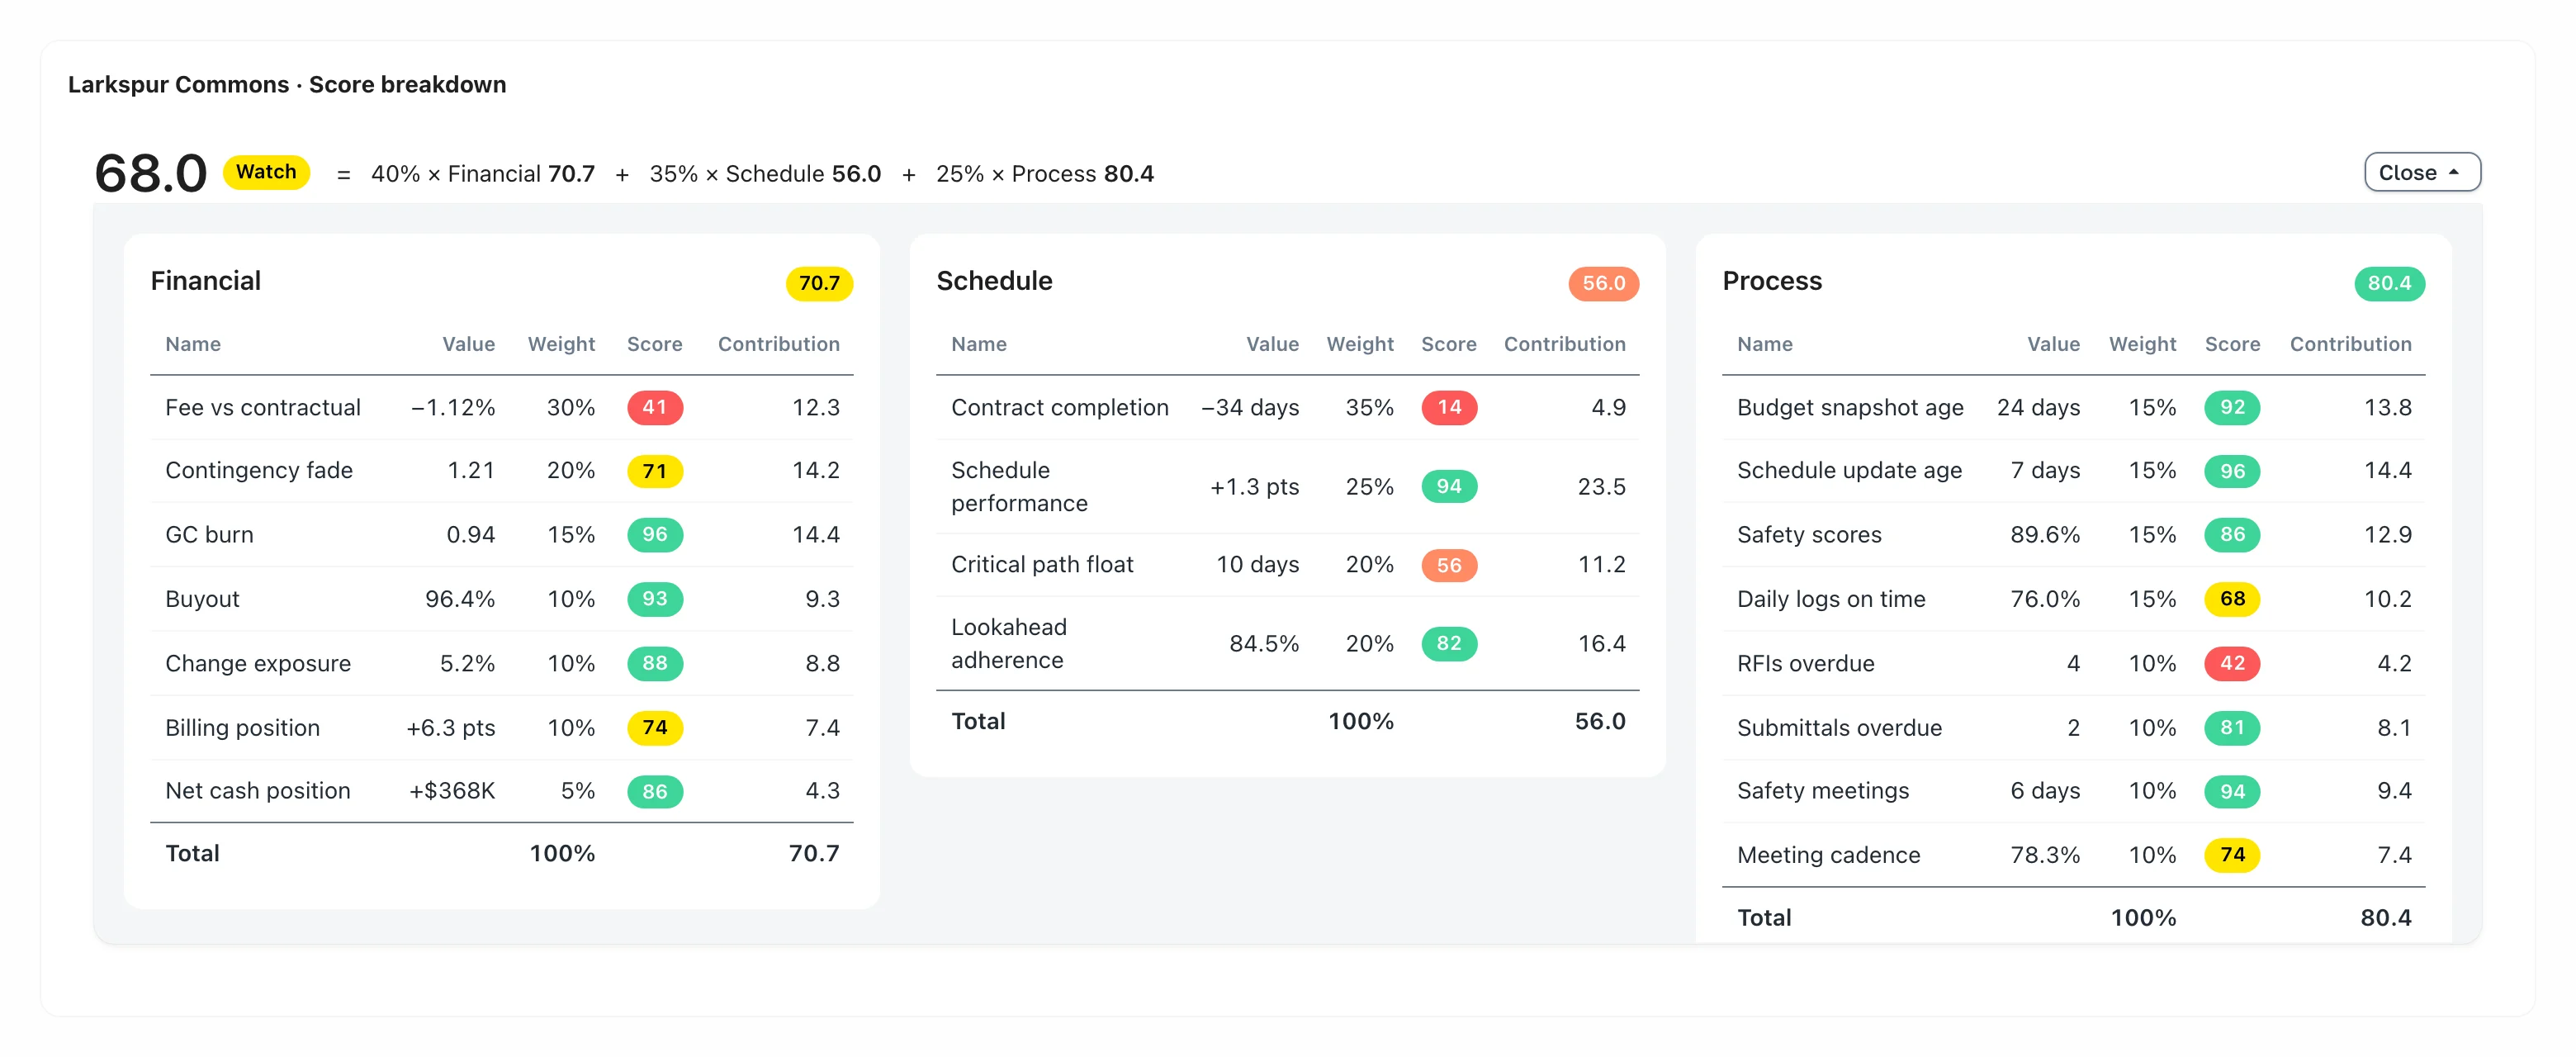
“I just wanted to know which of my projects needed attention. When I started digging into everything it takes to make those risk flags trustworthy, I gave up. Projexion built it in five minutes, and I use it every morning. I'd never have been able to do that myself.”
Today's risks, already triaged
No probability score. No mystery engine. Just a clear signal, which project, why it's happening, and what to do next.
What contractors use it for
Fifteen jobs, from the WIP meeting to the last lien waiver. Here are the ones most teams start with.
Ask your portfolio a question. In Projexion, or in Claude.
IRIS answers in plain English with the chart and the dashboard behind it. If your team already lives in Claude or ChatGPT, plug your portfolio in through MCP and ask there.
Either way it reads the same cleaned-up numbers as your dashboards, and checks your permissions on every question.
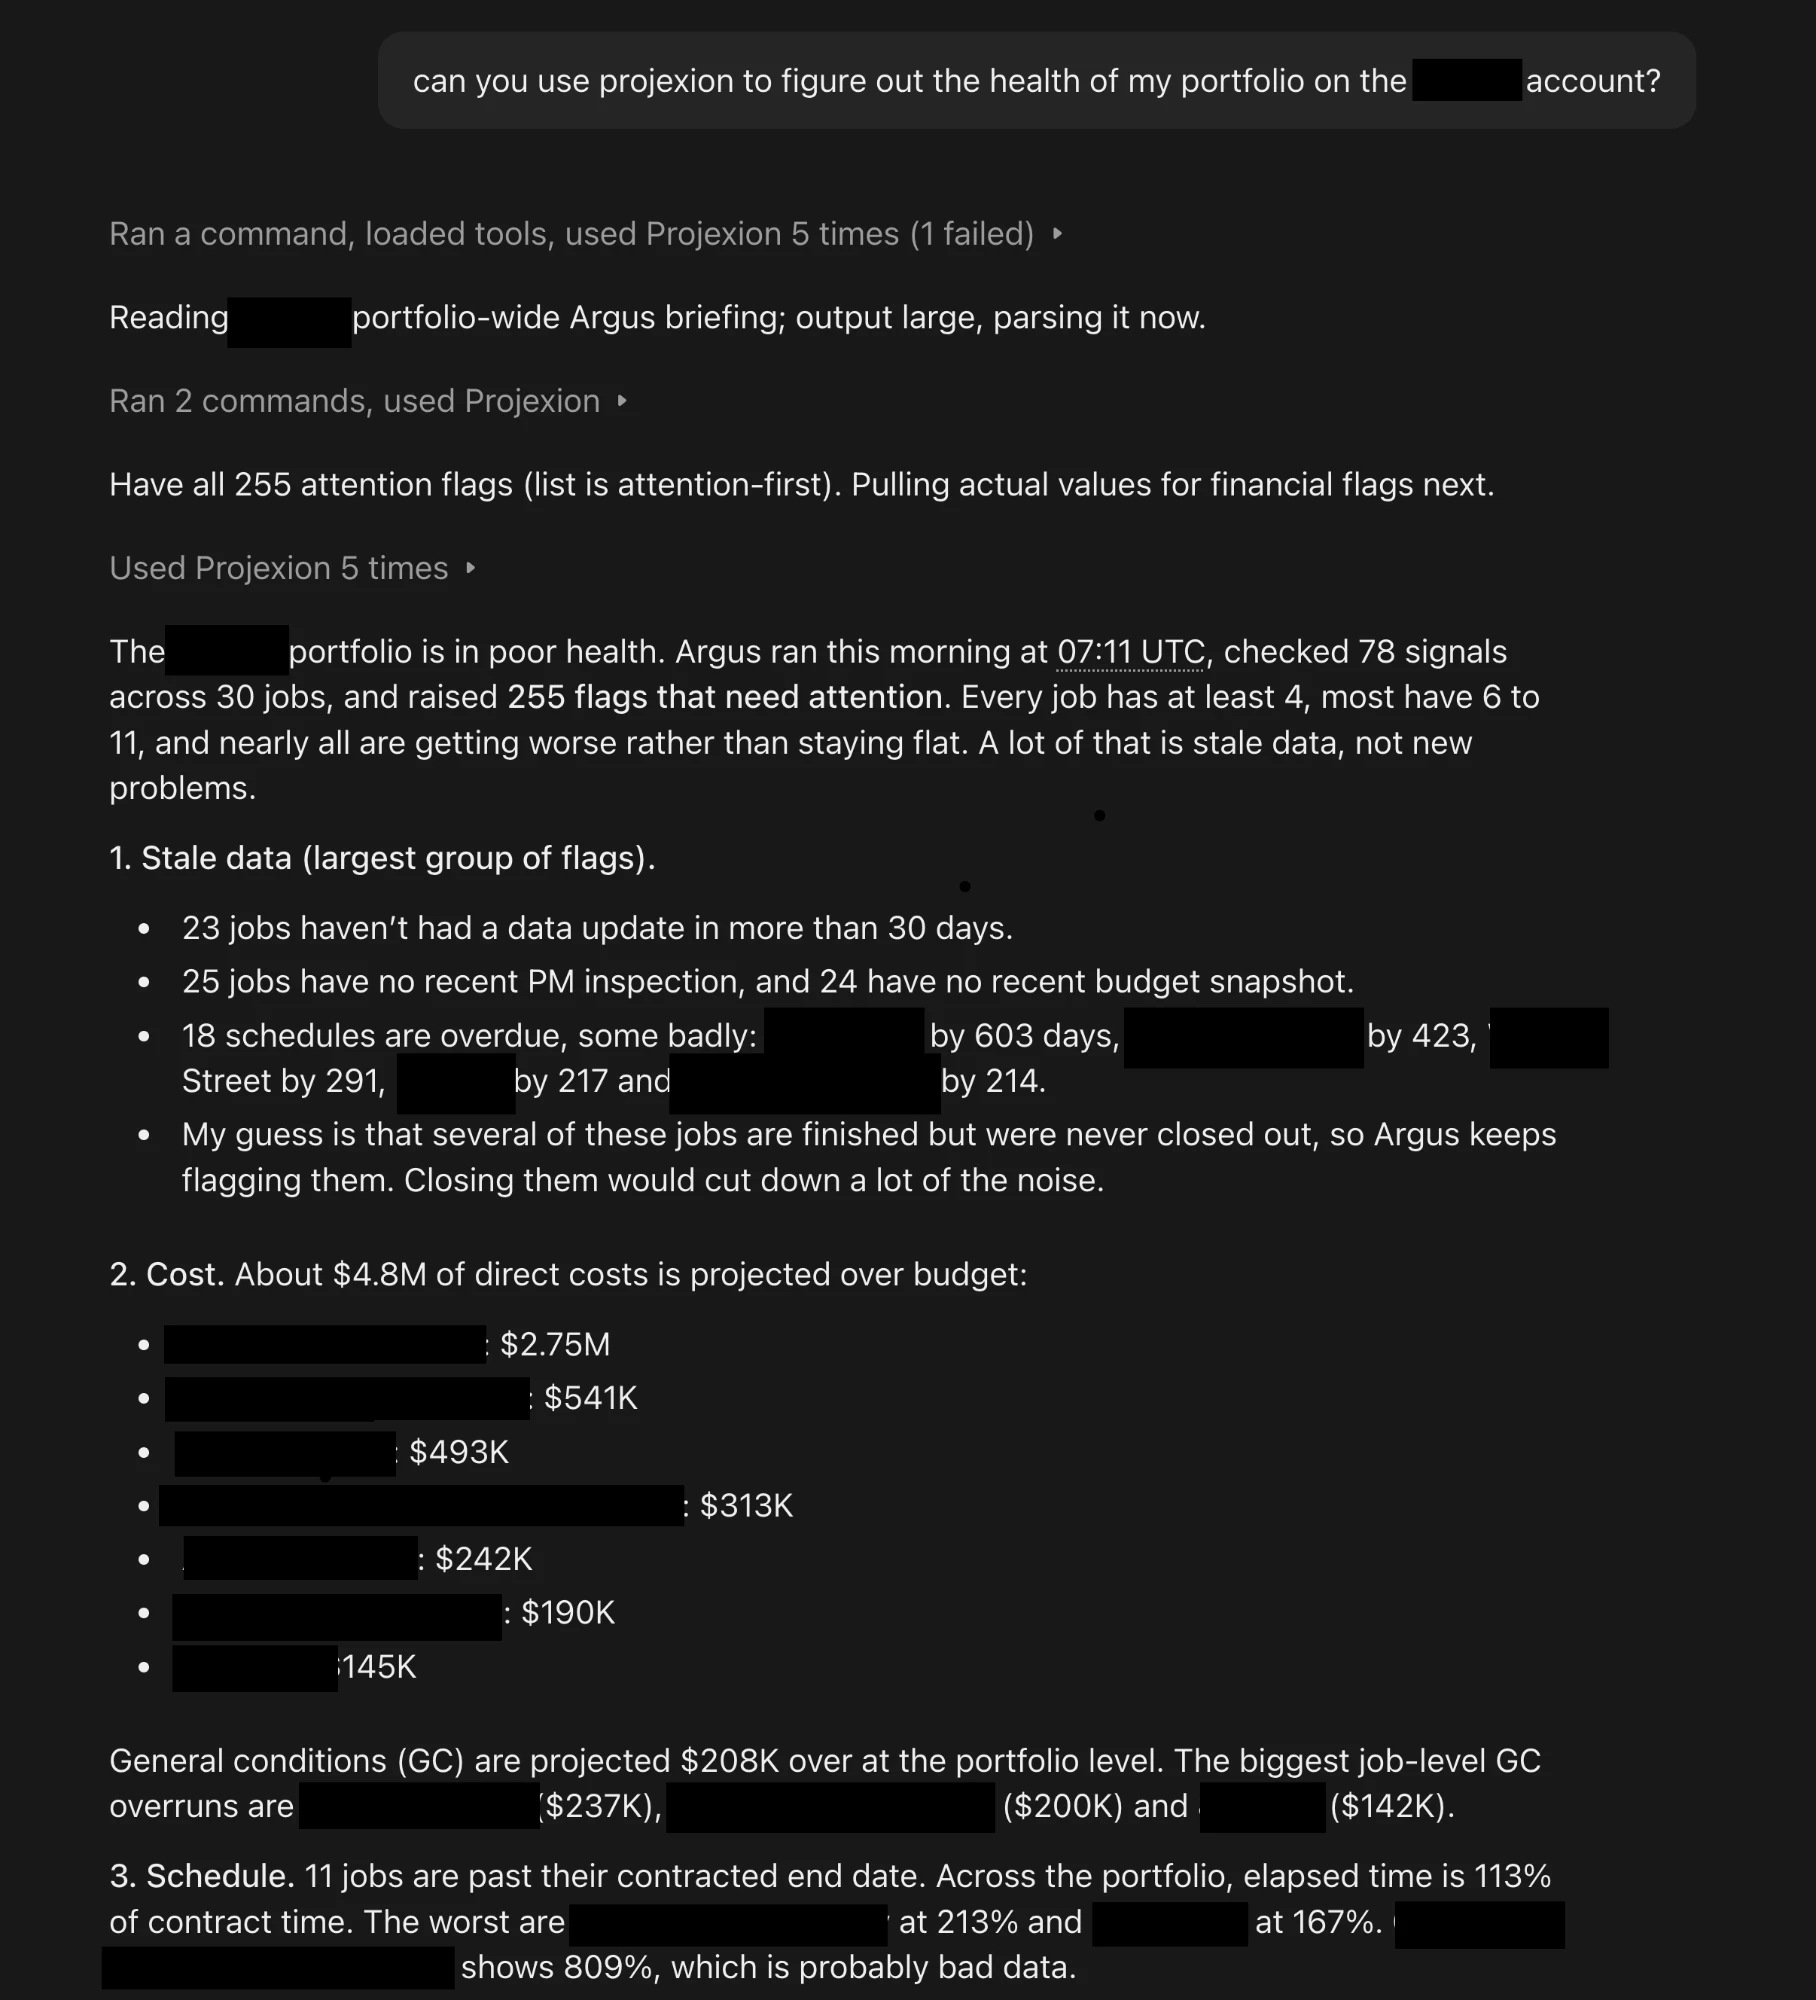
Real numbers from real contractors
See your portfolio the way Argus does.
Book a demo and we'll show you a briefing built on your real data. First dashboards in a week, and a way out at month three.