
Use case · Operations
Catch at-risk projects before schedules slip.
A VP of Operations usually learns a project is in trouble at the monthly review, by which point the schedule has slipped and the variance is baked in. The signals were in the data all along.
The morning briefing, already triaged
Same rules across every project overnight. Which project, why, and what to do next.
Needs attention
Project 2025-127
41 days since last PM inspection · schedule slippage 134 days · budget variance 31%. Source: Procore + Sage.
Trigger PM review, escalate to ops leader
Worth watching
Project 2024-455
49 days since last schedule update · fee variance trending negative.
Request updated schedule from scheduler
Worth watching
Project 2026-089
Forecasted fee dropping · contractual 11.9% vs forecasted 12.5%, trend reversing.
Surface in next financial review
Momentum
Project 2024-310
All signals green · 86% budget expended · 98% complete · TRIFR 0.
Use as a reference for similar pursuits
What's on the dashboard
Examples from the dashboards contractors run in Projexion today.
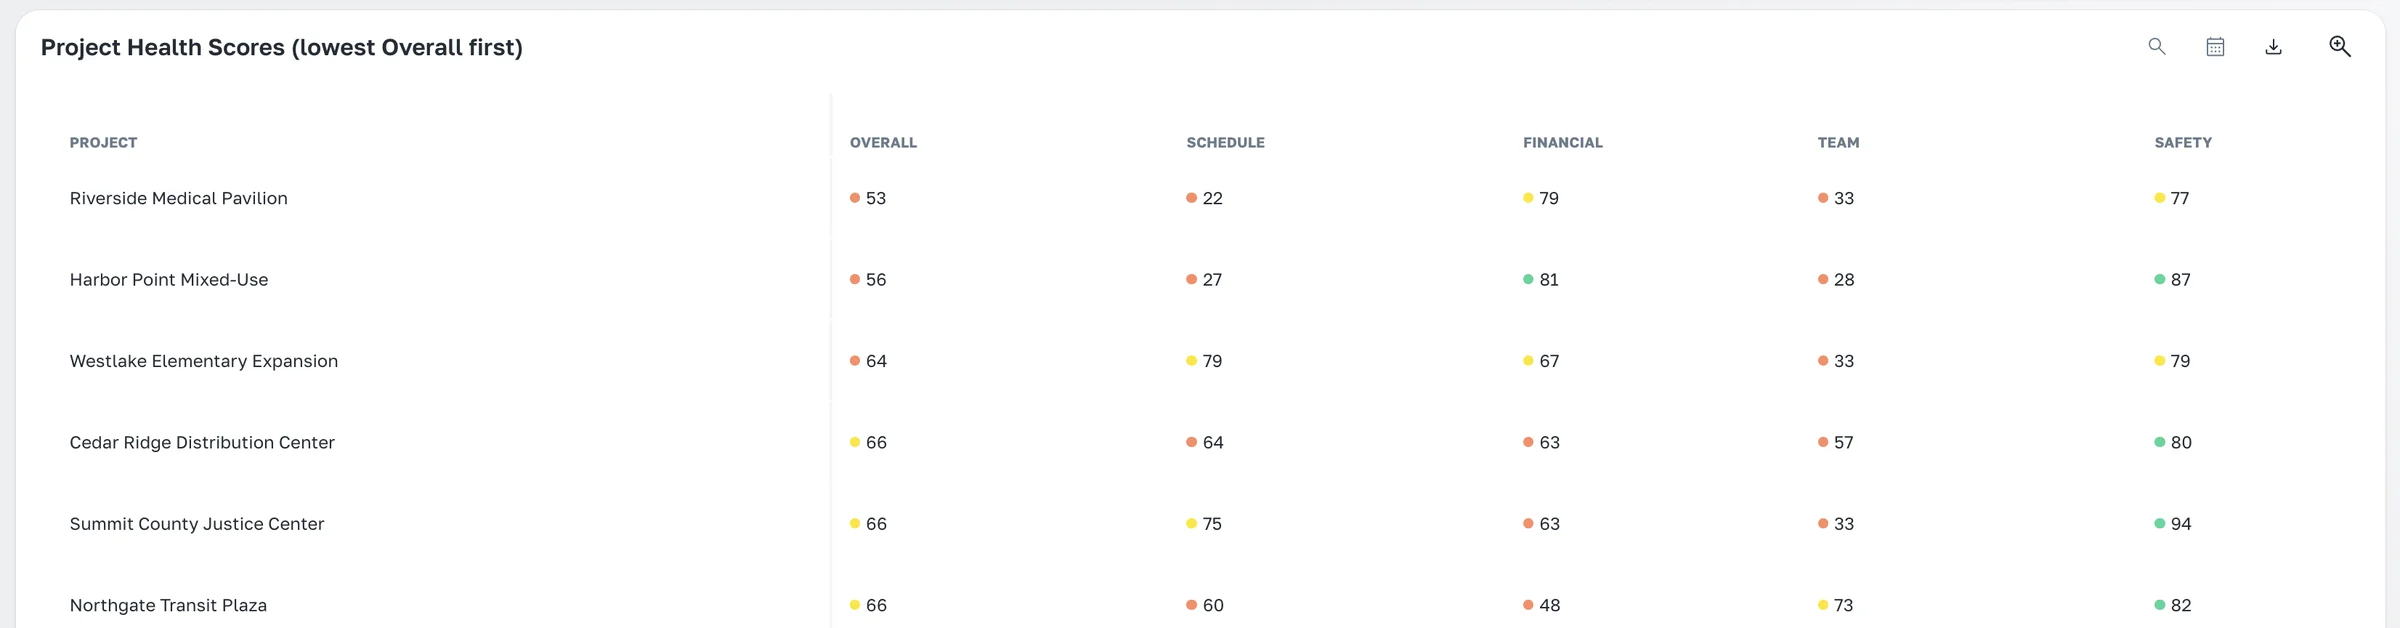
Project health scores
One score per project built from financial, schedule, and process components.
Project scorecards
Every job graded across your KPIs, sorted worst first.
Argus monitors
The open monitors per project, by urgency and owner.
Schedule performance
Planned vs actual completion and days since the last update.
Financial performance
Budget variance, fee fade, and contingency burn.
Health summary
How the portfolio splits across healthy, watch, and at risk.
Argus, every morning
Risks show up before the meeting
Argus runs the same rules on every project overnight and hands each person the handful of things to act on today, with the reason and a recommended next step.
Same rules on every project
Escalates to the right owner
Explains why, no mystery score
The outcome
The VP steps in on 2025-127 the same morning, while the slippage is still recoverable. No project slips through because someone forgot to check.
The features behind it
Argus — morning briefing
Today's risks, already triaged. Which projects, why, and what to do next.
Explore →
Full calculation editor
Build any metric step by step, no SQL. Define it once, then it applies everywhere.
Explore →
Dashboards & analytics
Portfolio overview and project-on-a-page views with full drill-down.
Explore →
16+ widget types
Charts, score cards, tables, maps, weather, and more. Browse the whole library.
Explore →
Automatic distributions
The Monday report sends itself, with live numbers, to exactly who should see them.
Explore →
IRIS — Your BI Agent
Ask your portfolio a question, get the chart and the dashboard back. Ask, don't dig.
Explore →
Know what to act on, before your coffee cools off.
See the morning briefing on your own portfolio.