
Use case · Operations
Portfolio visibility at scale.
Finding out how your projects are doing usually means manual analysis and a standing run of weekly meetings, and the answers arrive too late and too inconsistent to act on. Swap the ritual for a live, single-page view.
What's on the dashboard
Examples from the dashboards contractors run in Projexion today.
Core overview
Active projects, contract value, projected fee, and approved changes on one page.
Sliced every way
The same view by office, by project type, and by operations leader.
Course of construction
Separate cuts for office executives and field executives.
Fees & schedule progress
Fee trends and schedule progress across every active job.
Portfolio mix
Where the volume sits, by type, region, and size.
Map
Every job on a map, clustered by region with its contract value.
One filter instead of a meeting
"How are we doing?" becomes a filter
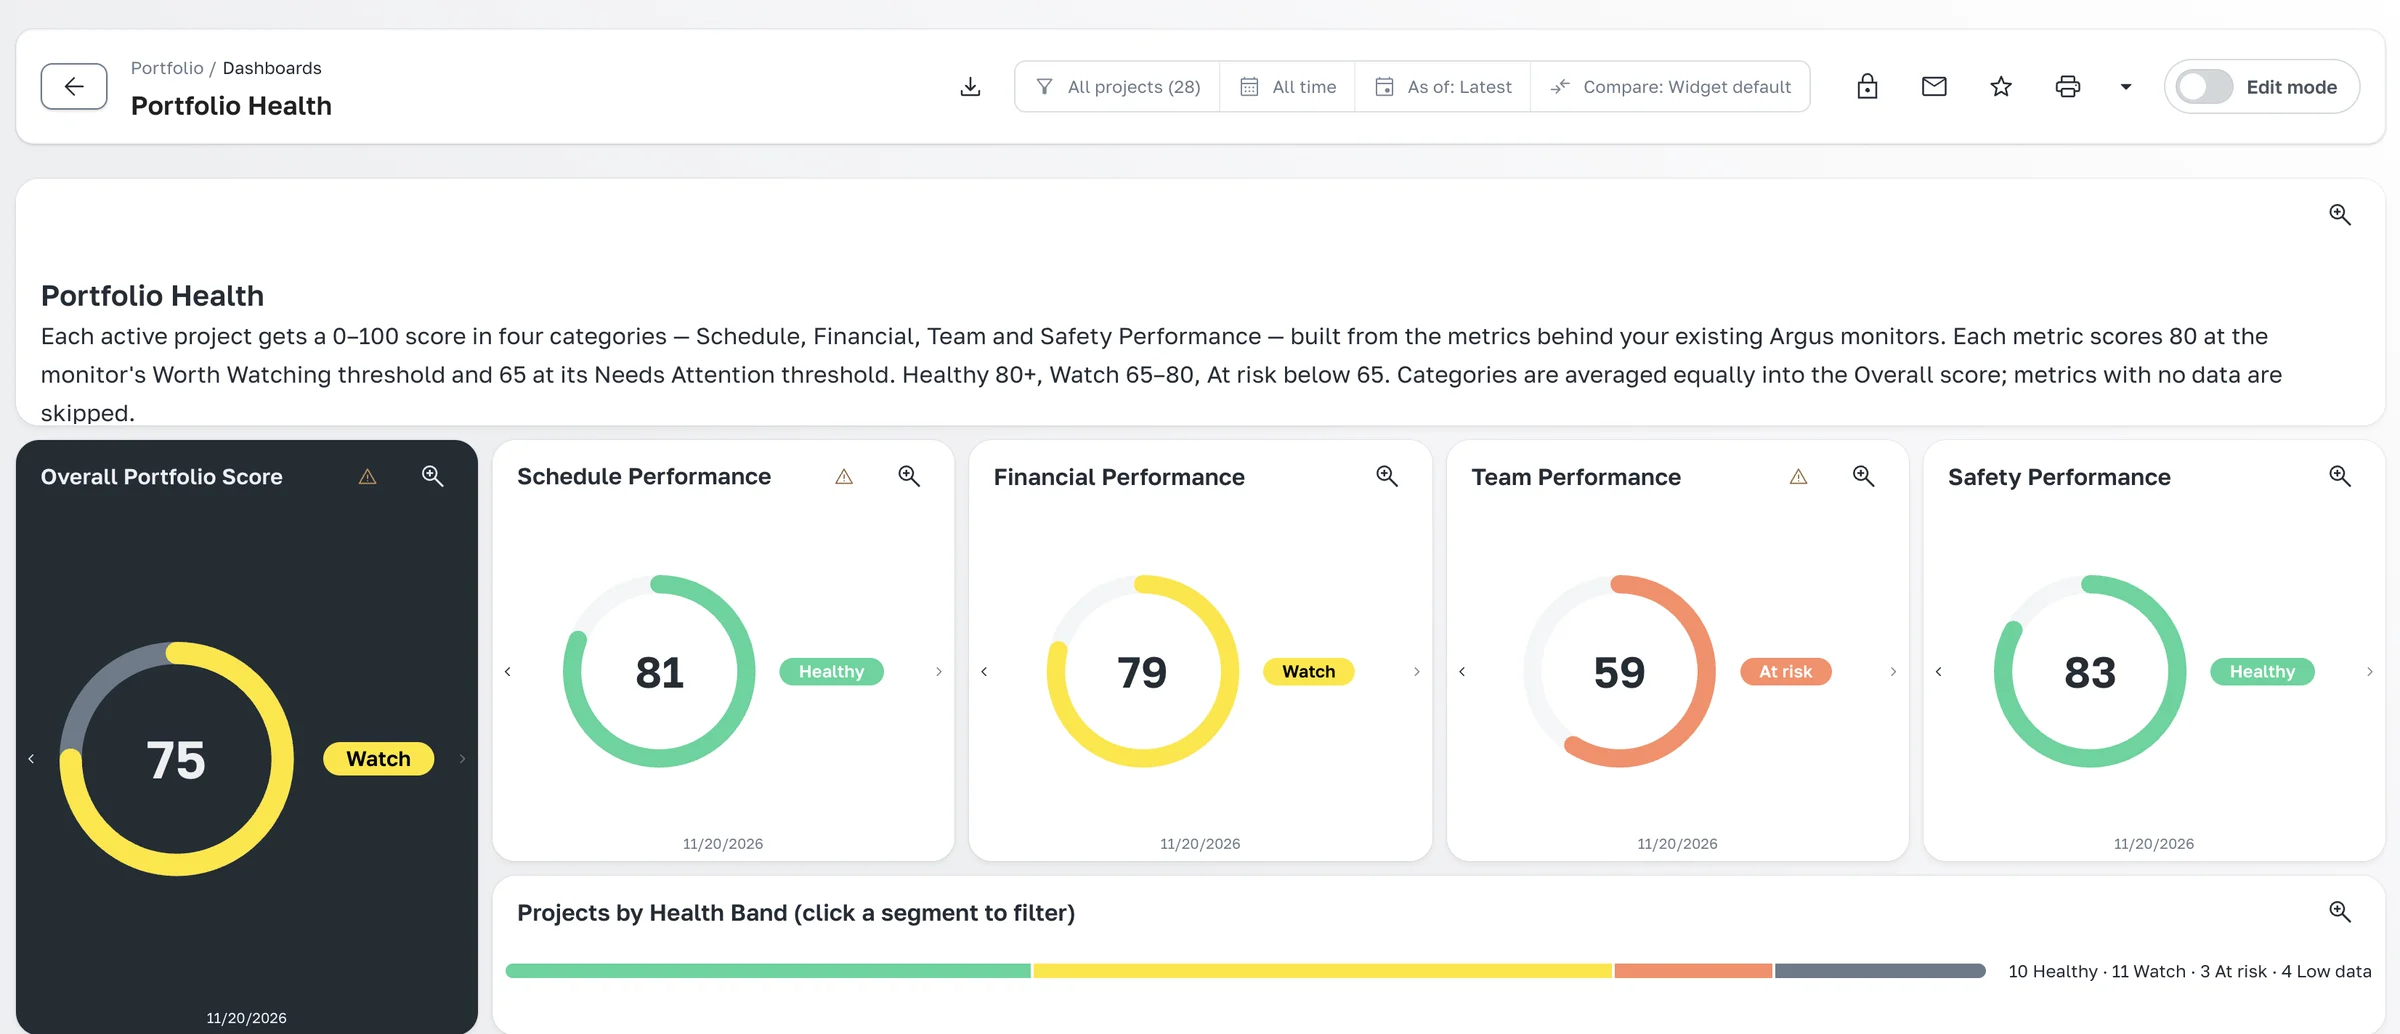
Projexion brings schedule, financial, and performance data into one live view you can slice by leader, region, type, or office. Leadership spots the risk and moves resources the same day.
Portfolio health in a single bar
Drill from the portfolio to the line item
Saved views per leader
The outcome
A ~$300M Florida GC swapped 75+ meetings a week for a live portfolio view, mitigated a $1M+ internal build, and saw 20X ROI.
The features behind it
Dashboards & analytics
Portfolio overview and project-on-a-page views with full drill-down.
Explore →
16+ widget types
Charts, score cards, tables, maps, weather, and more. Browse the whole library.
Explore →
500+ KPI library
Construction-specific KPIs and dashboards out of the box. You never start from a blank page.
Explore →
Data foundation
Clean up and reconcile 10+ systems into one source of truth. Same job, four codes, one project.
Explore →
IRIS — Your BI Agent
Ask your portfolio a question, get the chart and the dashboard back. Ask, don't dig.
Explore →
Full MCP Support
Plug your portfolio straight into Claude, ChatGPT, or Cursor, scoped to your permissions.
Explore →