Analyze · KPI library
500+ construction KPIs, already built.
Financial, schedule, safety, field-compliance and portfolio metrics come defined, calculated and visualized out of the box. If you can name the 5–10 things you need to know today, chances are we've already built it.
Breadth across every domain a GC runs
Financial / WIP
Contract value, projected fee, change orders, budget variance, % billed vs % complete, continuous, not month-end.
Schedule
Planned vs actual completion, slippage, baseline variance and earned-value curves.
Safety
TRIFR, LTIFR, total man-hours, injuries and near-misses by company and project.
Field compliance
Photos per day, daily logs, toolbox talks, FCMs and schedule updates across 16+ weeks.
Days-since signals
Days since last PM inspection, schedule update, or budget snapshot, colored at a glance.
Geographic / portfolio
Volume and risk by region for staffing and pursuit strategy.
Ready to use, ready to tailor
You're never starting from a blank canvas
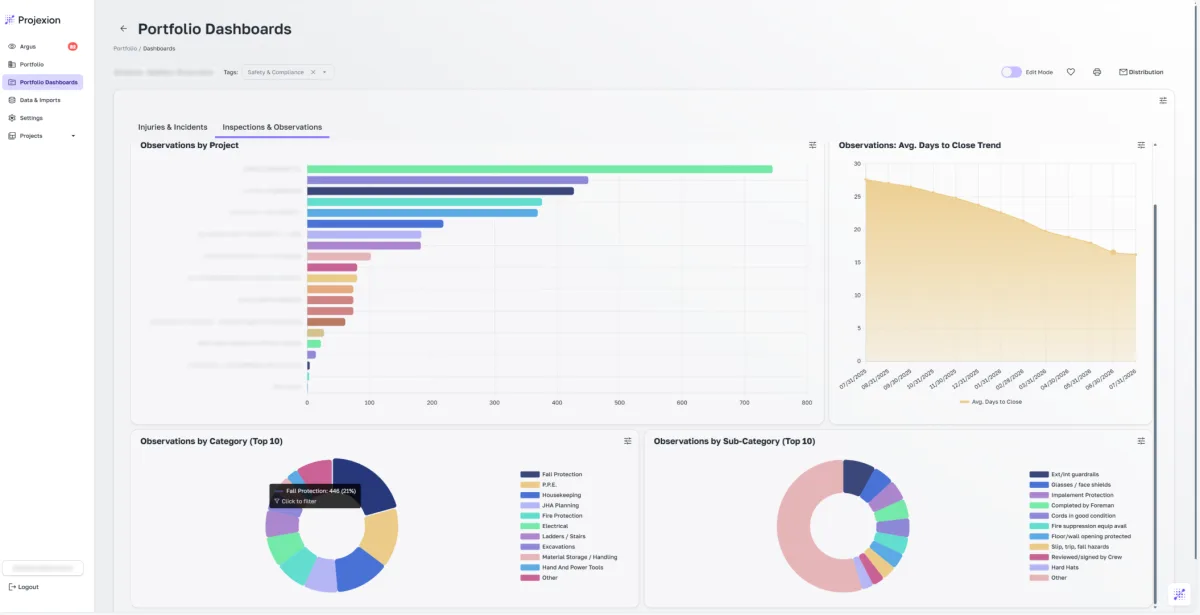
Pre-built dashboards (portfolio overview, project-on-a-page, financial/WIP, safety, geographic heatmap) install in a click. Every KPI is a starting point you can clone and extend.
Project templates, define once, apply to every project
Cross-platform by default (Procore + Sage + P6)
Missing a metric? It's added monthly as part of the partnership