Act · Dashboards & analytics
Every project, on one page.
Live, customizable views where a GC monitors portfolio and project health at a glance, compose from charts, tables, KPIs, and maps, then drill from a headline number to the line item behind it.
Two views anchor everything
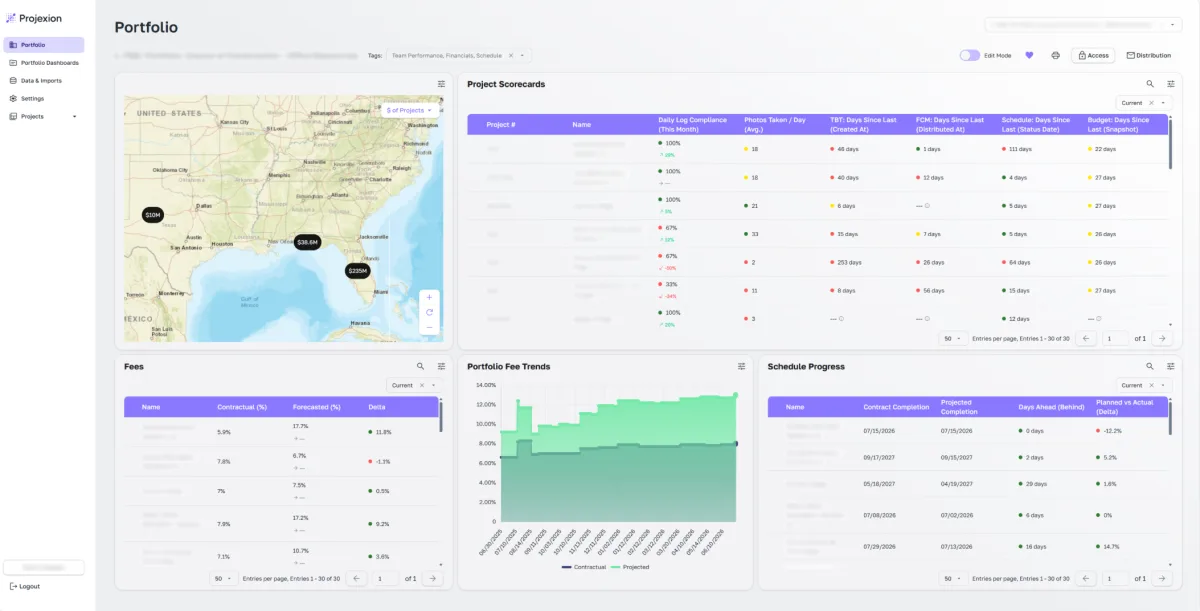
Portfolio overview
Every active job on one page, financial and schedule KPIs side by side, days-since signals colored on every row, sliced by leader, region, type, or office.
Project-on-a-page
One job, all its numbers, same definitions everywhere, with editable overrides PMs annotate without ever dirtying the source system. Audit-ready by default.
The control tower
Risk surfaces before the meeting, not in it
Compose from a full widget gallery (XY graphs, pie/donut, histograms, tables, KPI scores, maps, weather forecasts, and section groups) on a 50-column responsive grid.
Drill-down from a bar or cell to the underlying records
Filter any dashboard by project, team or cost code
Project templates, define once, auto-apply to every job
Real-time rendering, identical widgets computed once
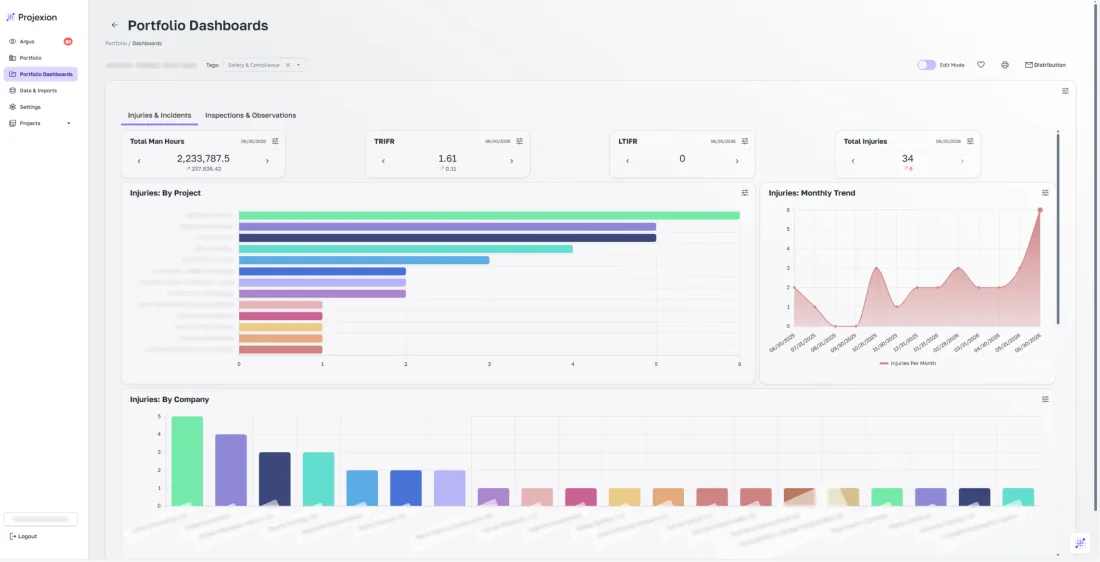
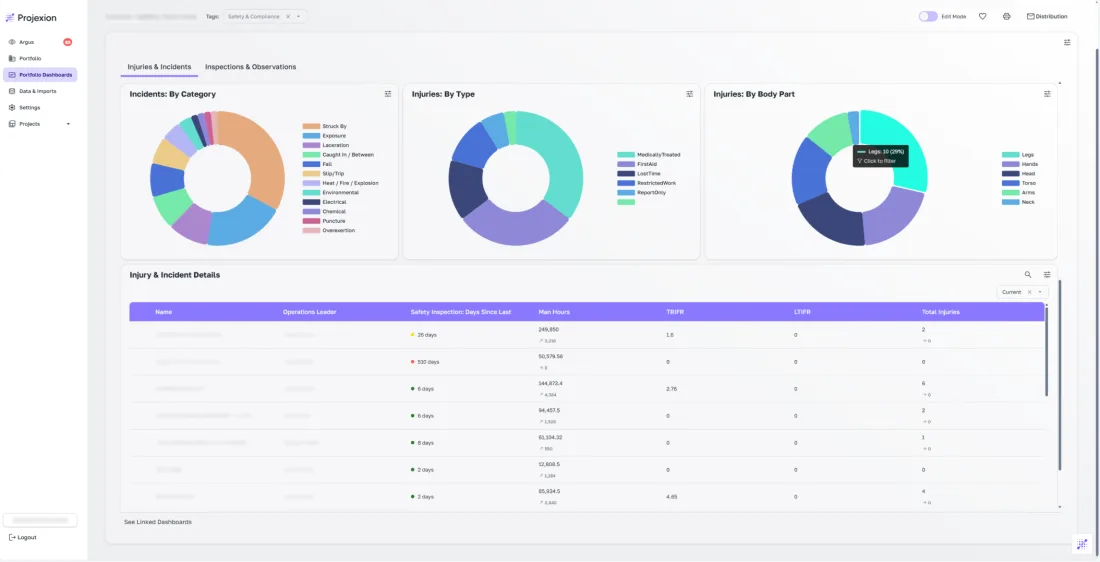
Safety and compliance, out of the box
Injuries, incidents and inspections, tracked across the whole portfolio, no setup required.