Analyze · Calculations engine
Define a metric once. Trust it everywhere.
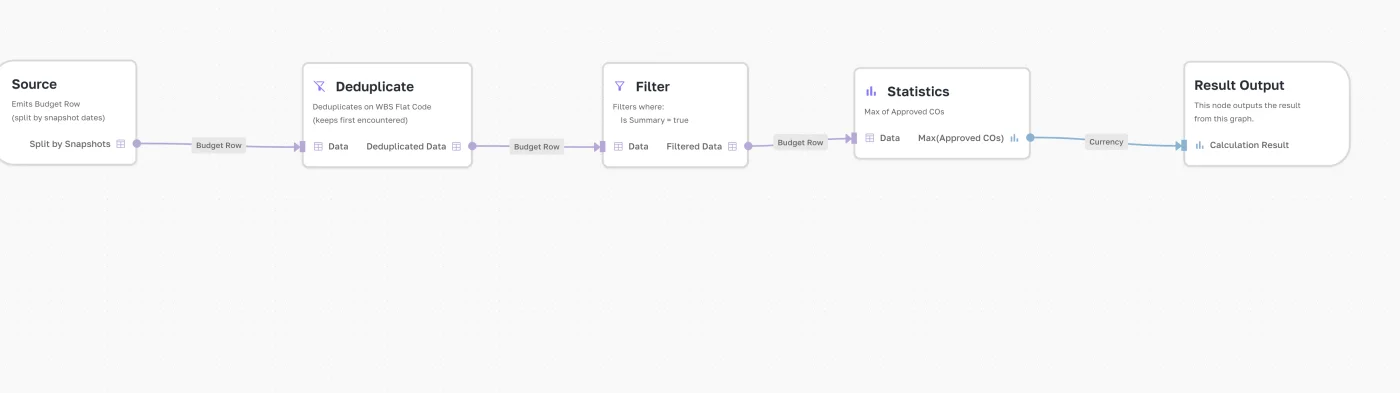
A visual, no-code builder that turns homogenized data into a KPI your whole company agrees on, budget variance, cost-to-complete, earned value, a health score. No SQL, no spreadsheet macros.
Everyone defines CPI differently
Until definitions are set once, then applied everywhere
Without shared definitions, every team's spreadsheet computes margin a little differently, and dashboards produce arguments instead of decisions.
Define "Budget Variance %" once and reuse it across every project and dashboard. Change it once, and every dashboard and alert reflects it instantly.
Visual graph builder, drag nodes, nest calculations
Operators: group-by, comparison, forecasting, days-since
Status scoring, map values to colored bands
Project-specific overrides without breaking the template