
Use case · Field, safety & people
Safety performance across every job, every month.
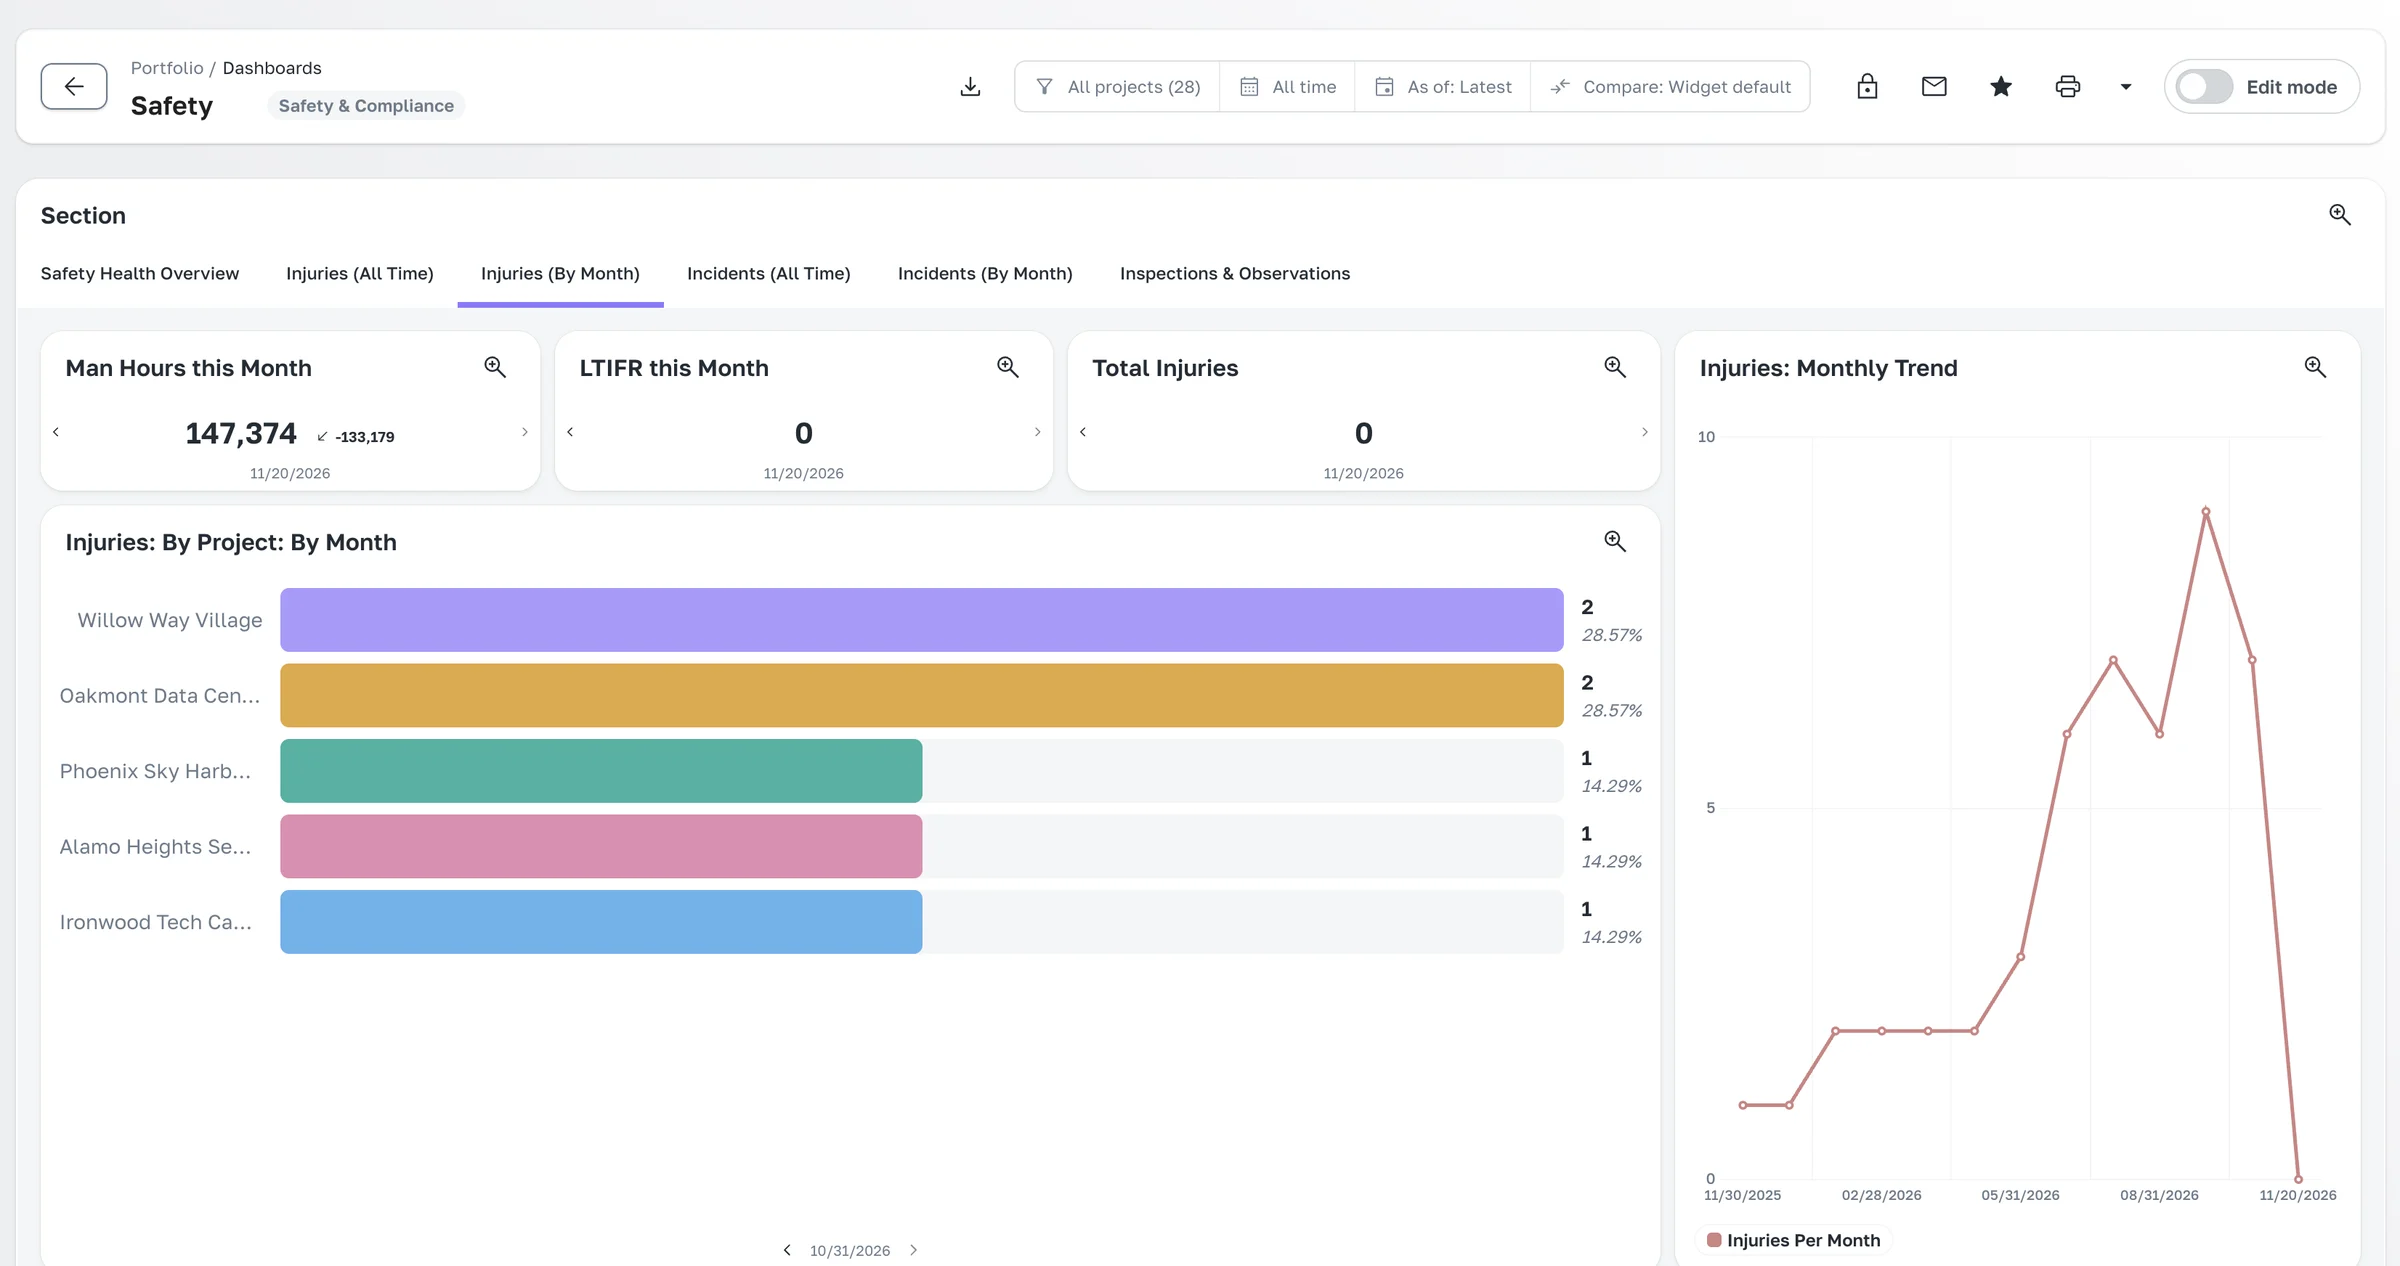
Safety numbers usually live in a separate system and a quarterly slide. Projexion puts injuries, incidents, observations, and man-hours on the same dashboards as cost and schedule, so safety gets talked about every week.
What's on the dashboard
Examples from the dashboards contractors run in Projexion today.
TRIFR & LTIFR
Recordable and lost-time frequency rates, this month and rolling.
Injuries & incidents
By company, type, body part, and project, with monthly trends.
Man-hours
Total and monthly man-hours, and man-hours per incident.
Inspections & observations
Safety inspections, observations by category and subcontractor, and days to close.
Safety meetings
How many happened this month, and days since the last one.
Incident log
Every incident with its filing type, project, and status.
Out of the box
Safety dashboards on day one
The safety dashboards come pre-built on your Procore data, portfolio-wide and per project. Argus adds the morning signal, a near-miss to review, a site that hasn't held a safety meeting in two weeks.
Portfolio and per-project views
Trends by company and subcontractor
Safety alerts in the morning briefing
The features behind it
500+ KPI library
Construction-specific KPIs and dashboards out of the box. You never start from a blank page.
Explore →
Dashboards & analytics
Portfolio overview and project-on-a-page views with full drill-down.
Explore →
Argus — morning briefing
Today's risks, already triaged. Which projects, why, and what to do next.
Explore →
Automatic distributions
The Monday report sends itself, with live numbers, to exactly who should see them.
Explore →
Integrations & connectors
Procore, Sage 300 CRE, Autodesk, P6/MSP, Excel, hooked up once, synced nightly.
Explore →
16+ widget types
Charts, score cards, tables, maps, weather, and more. Browse the whole library.
Explore →