
Use case · Finance & accounting
Job cost, buyout, and contingency, before they surprise you.
Cost overruns rarely show up all at once. They show up as a buyout that stalls at 70%, contingency that's half gone at 30% complete, and general conditions creeping past budget. Projexion watches all three on every job.
What's on the dashboard
Examples from the dashboards contractors run in Projexion today.
% of budget expended
Job cost to date against the revised budget, with the trend over time.
% of buyout committed
How much of the budget is under subcontract or PO, and how fast that moves.
Contingency usage
Starting contingency, what's used, and what's left, in dollars and percent.
Projected budget variance
Projected over/under, excluding general conditions, so the trades tell their own story.
Projected GC variance
General conditions on their own line, because that's where fee leaks first.
Job cost detail
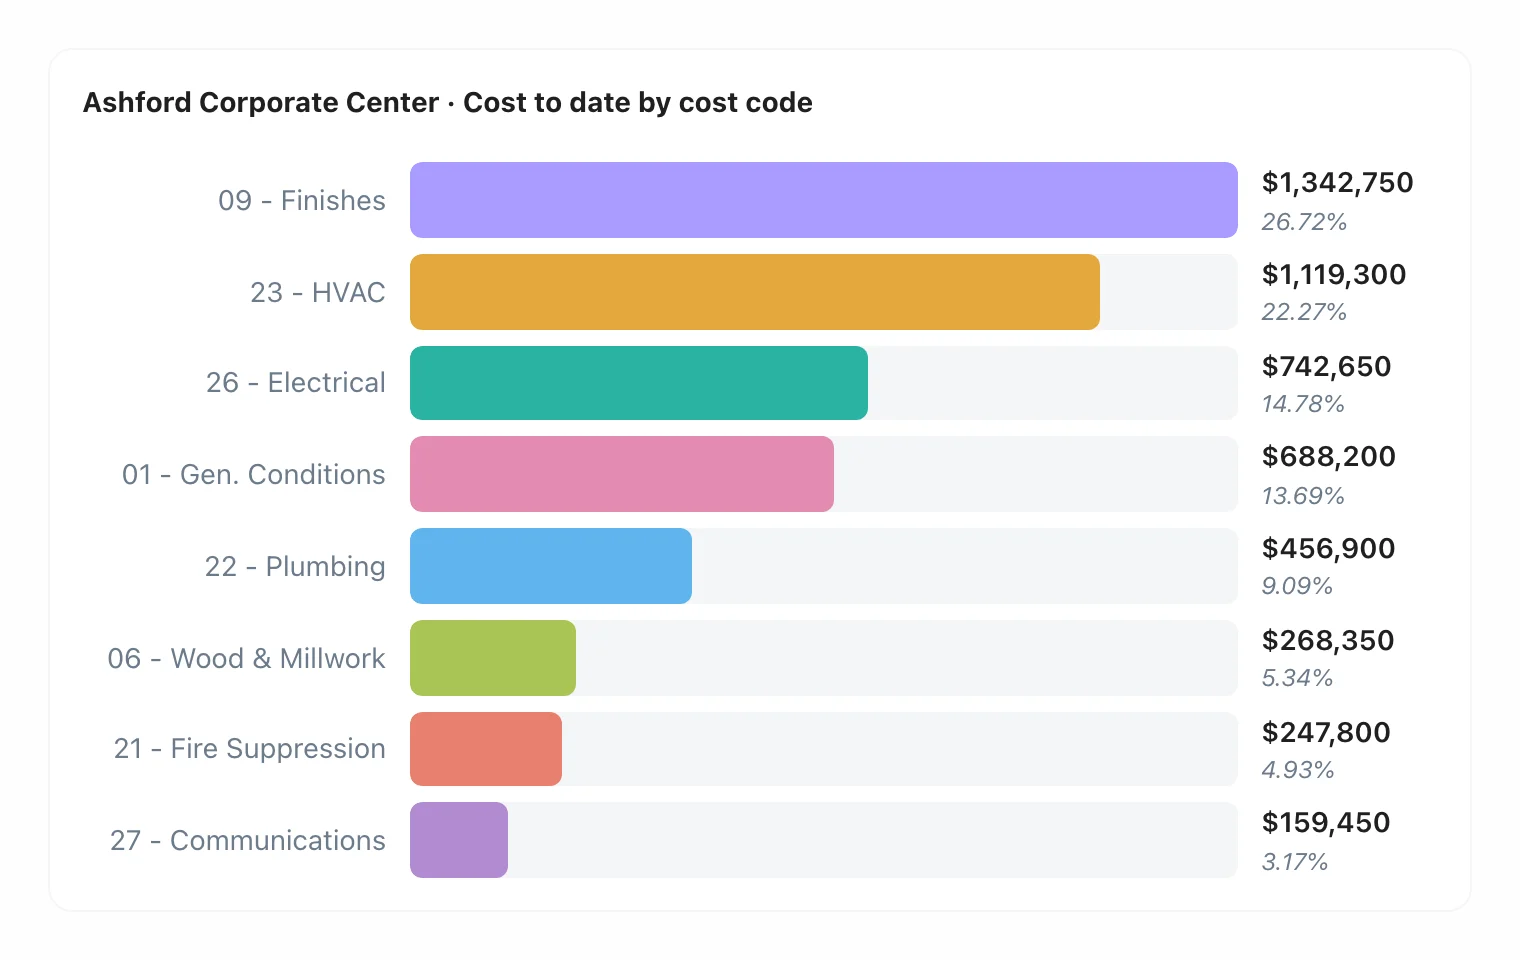
By cost code, category, and vendor, down to the AP invoice.
Every cost code, one click away
See where the money's going, then see why
Start at the portfolio, filter to the jobs where contingency is burning faster than the schedule, and drill into the cost codes doing it. The same calculation runs on every job, so a 12% variance means the same thing in Austin as it does in Houston.
Variance excluding GCs, and GCs on their own
The trend over time next to today's number
Alerts when buyout or contingency crosses your threshold
The features behind it
Full calculation editor
Build any metric step by step, no SQL. Define it once, then it applies everywhere.
Explore →
500+ KPI library
Construction-specific KPIs and dashboards out of the box. You never start from a blank page.
Explore →
Dashboards & analytics
Portfolio overview and project-on-a-page views with full drill-down.
Explore →
Argus — morning briefing
Today's risks, already triaged. Which projects, why, and what to do next.
Explore →
History & time machine
Imports keep dated snapshots, so you can open any dashboard the way it looked on January 1st.
Explore →
IRIS — Your BI Agent
Ask your portfolio a question, get the chart and the dashboard back. Ask, don't dig.
Explore →
Catch the fade while the job can still fix it.
See job cost and contingency on your own projects.