
Use case · Finance & accounting
Cash, AR, and AP on one page.
Profit on paper doesn't pay subs. Finance needs to know what's billed, what's collected, what's due out this week, and which jobs are eating cash, without waiting for the month-end close.
What's on the dashboard
Examples from the dashboards contractors run in Projexion today.
AR/AP aging profile
Receivables and payables bucketed by age, by job and across the portfolio.
AP forecast, weekly due
What has to go out the door each week, for the cash meeting.
% billed to date
Billing against % complete, and the billing trend month by month.
Vendor invoices
Every AP invoice by vendor and job, with its status.
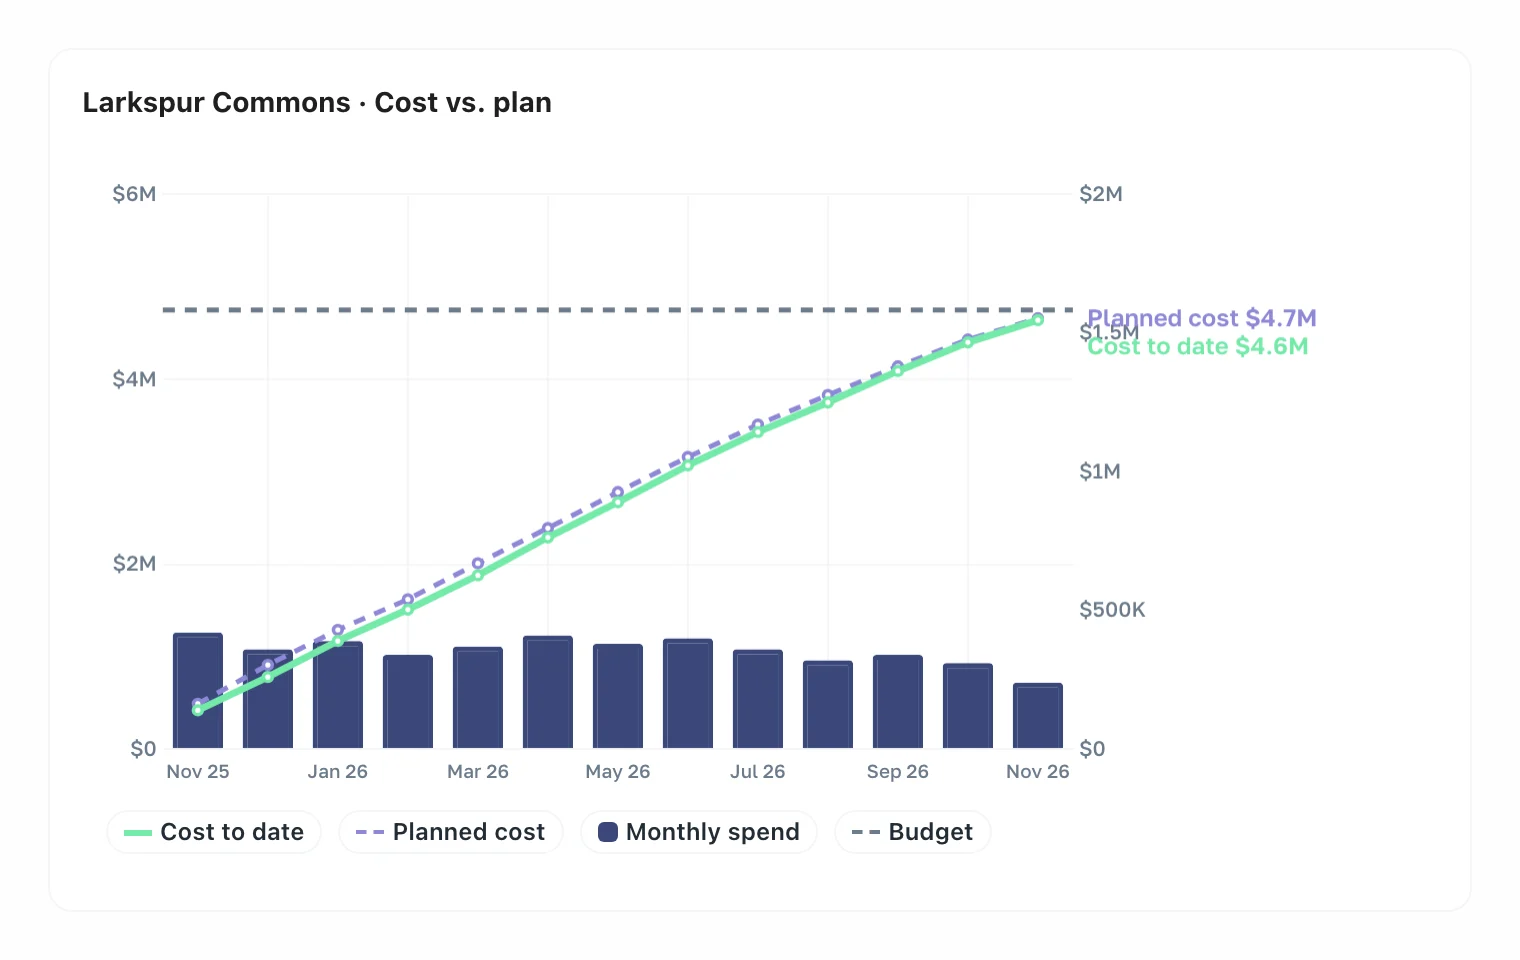
Budget & cash flow
Monthly cost against billing and cash, so the curve is visible early.
Contract & billing
Prime contract, billed to date, and retainage, per project.
Straight from the ERP
The cash picture, current every morning
Projexion reads AR, AP, and job cost straight from Sage 300, Foundation, or CMiC and lines them up with the project data from Procore. The cash meeting starts from the same numbers finance and operations both see.
AR and AP aging by job
Weekly AP due, forecast ahead
Billing trends next to cost
The features behind it
Integrations & connectors
Procore, Sage 300 CRE, Autodesk, P6/MSP, Excel, hooked up once, synced nightly.
Explore →
Data foundation
Clean up and reconcile 10+ systems into one source of truth. Same job, four codes, one project.
Explore →
Dashboards & analytics
Portfolio overview and project-on-a-page views with full drill-down.
Explore →
Automatic distributions
The Monday report sends itself, with live numbers, to exactly who should see them.
Explore →
Exports
Any table or score card to Excel, CSV, or PDF, from the app, IRIS, or Claude.
Explore →
Full calculation editor
Build any metric step by step, no SQL. Define it once, then it applies everywhere.
Explore →