Skip to content
Visualize · Widget library

16+ widget types. One for every question.

Charts, scores, tables, maps, and the weather at the jobsite. Every widget reads the same cleaned-up data and the same calculations, so a number means the same thing wherever it shows up.

The widget library

Charts, scores, tables, and the context around them. Every one reads the same data and the same calculations.
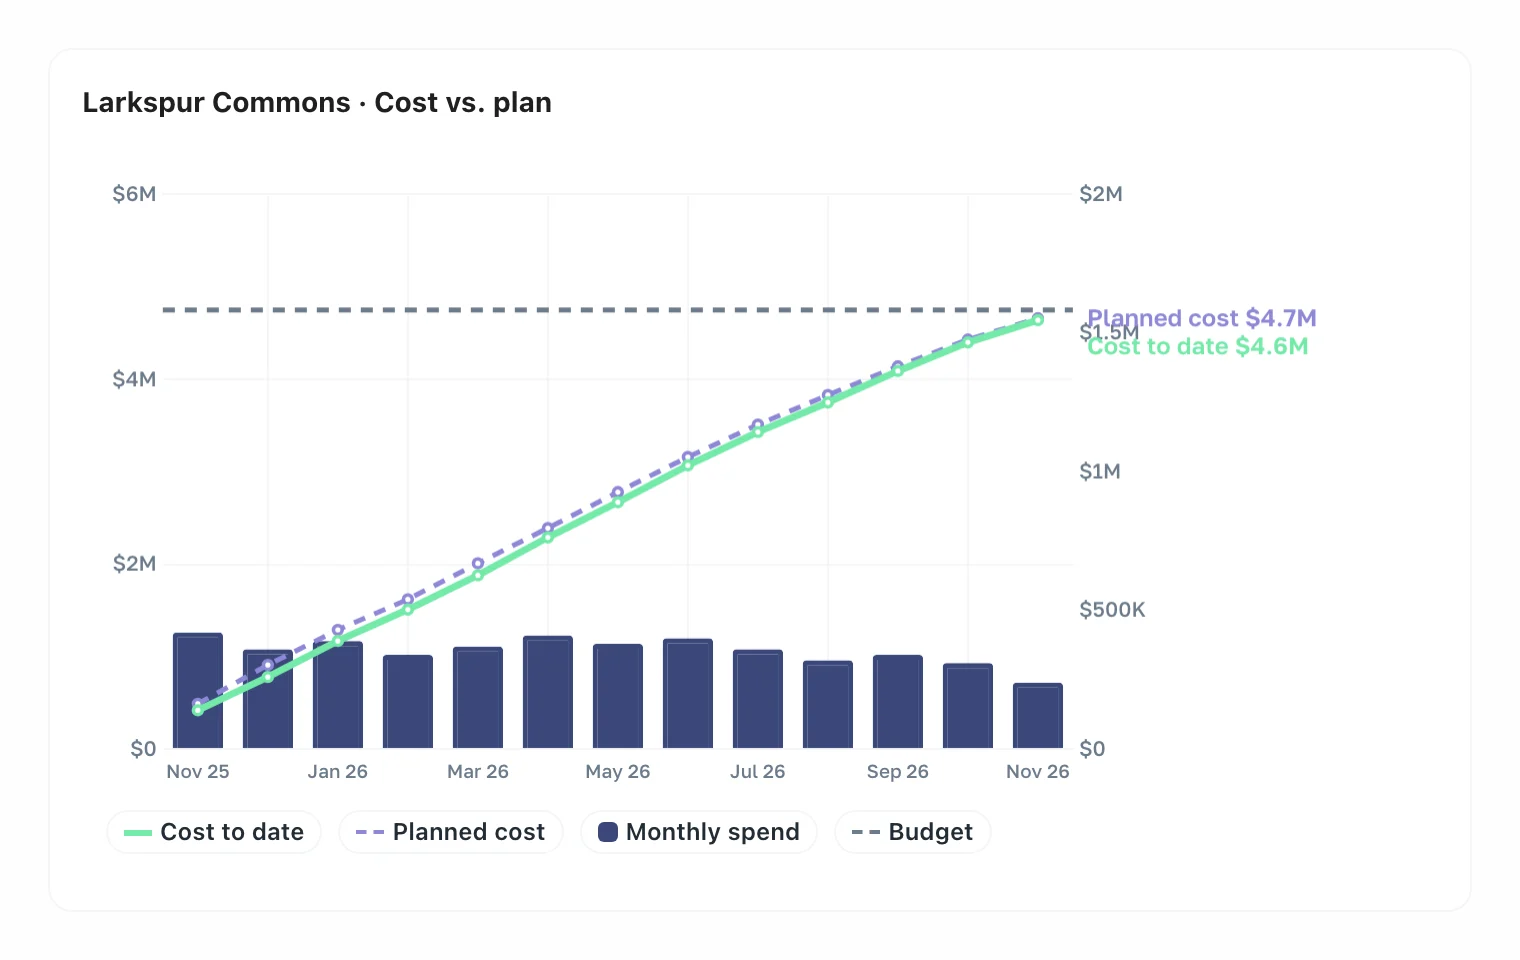
XY graph of cumulative cost to date against the planned spending curve and the budget, with monthly spend as bars
Charts
XY graph
Lines and bars over time or against any axis. Planned vs actual, cost curves, earned value, with reference lines and score bands.
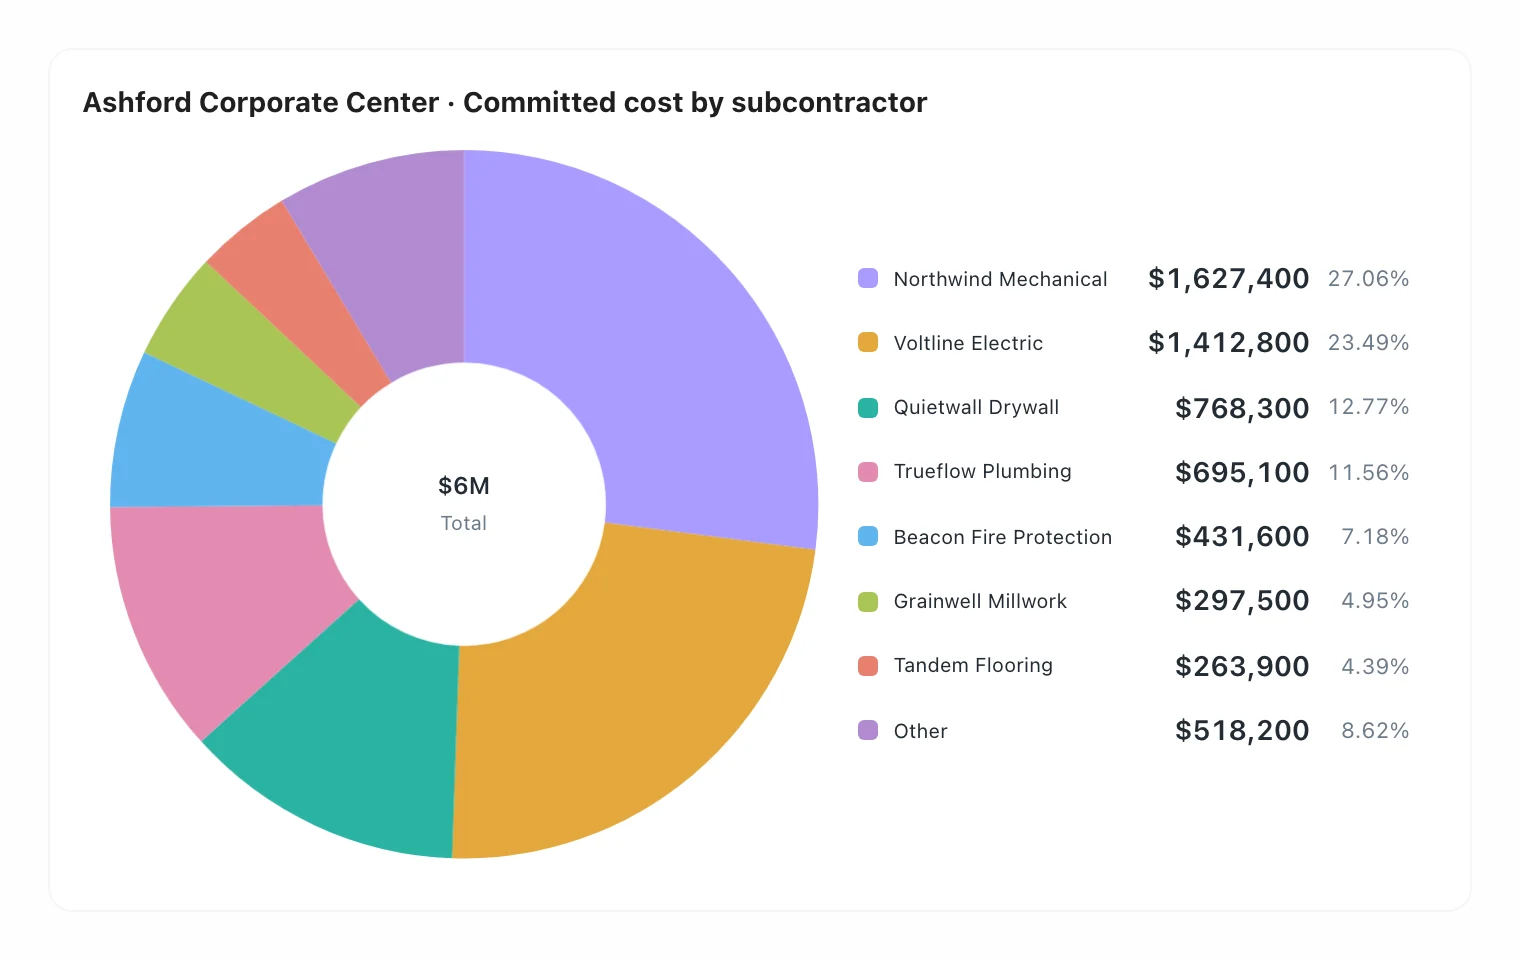
Donut chart splitting a project's committed subcontract cost by trade partner
Charts
Pie chart
Who's getting the money, which trade owns the change orders. Shares at a glance, with an Other bucket so it stays readable.
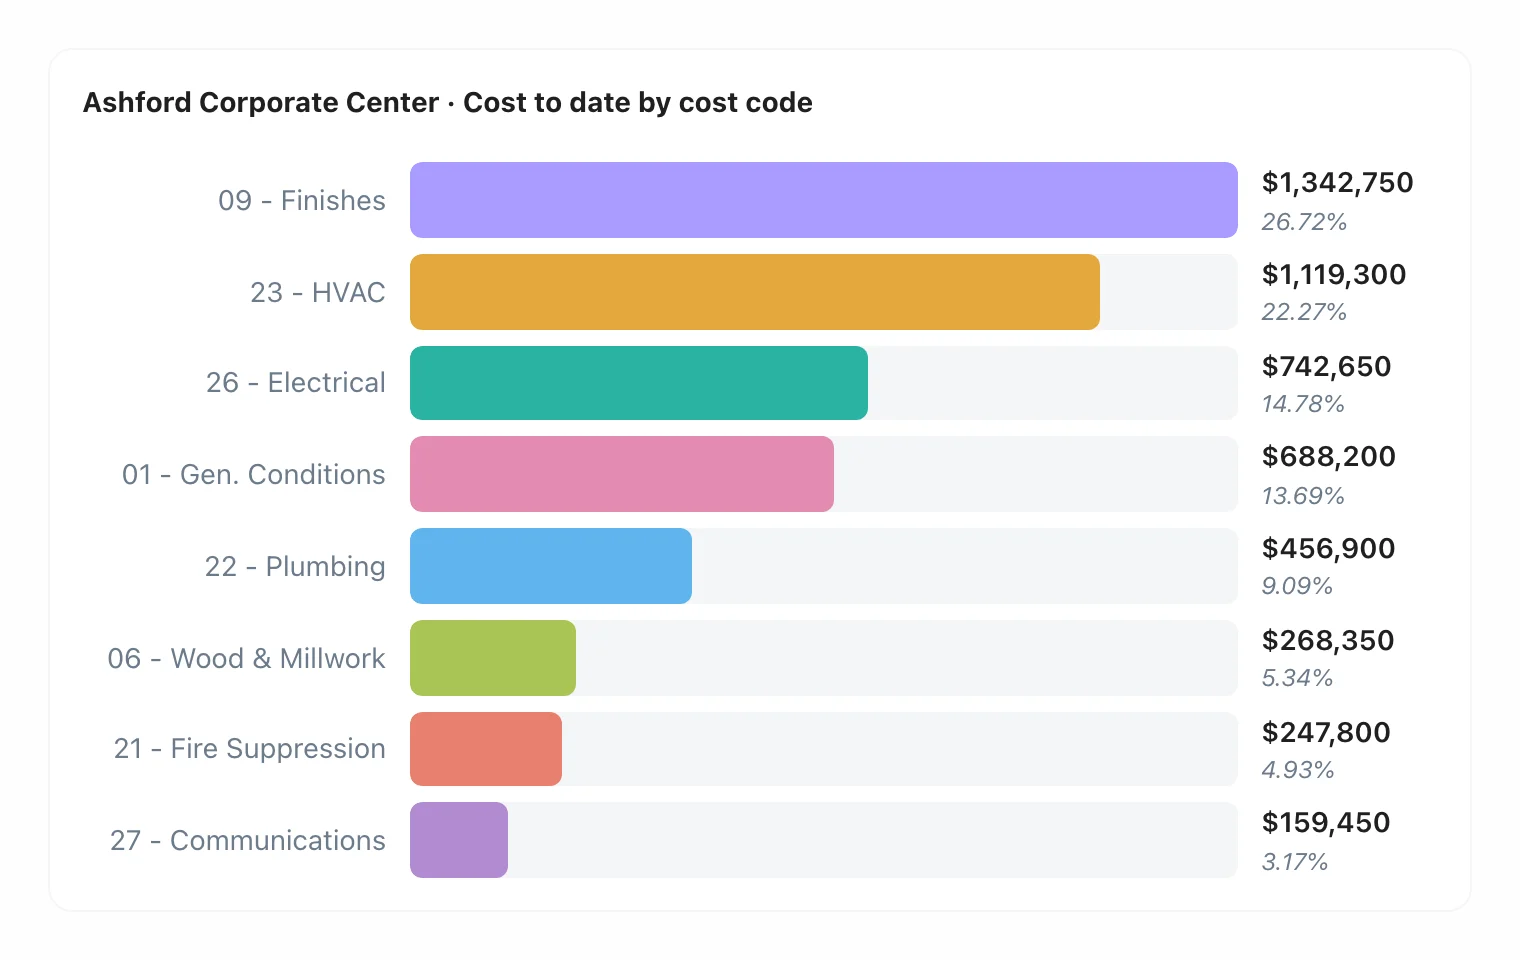
Ranked bars of cost to date by cost code, each with its total and share of the project
Charts
Histogram
Compare a value across projects, vendors, or cost codes, and layer a second grouping on top when one split isn't enough.
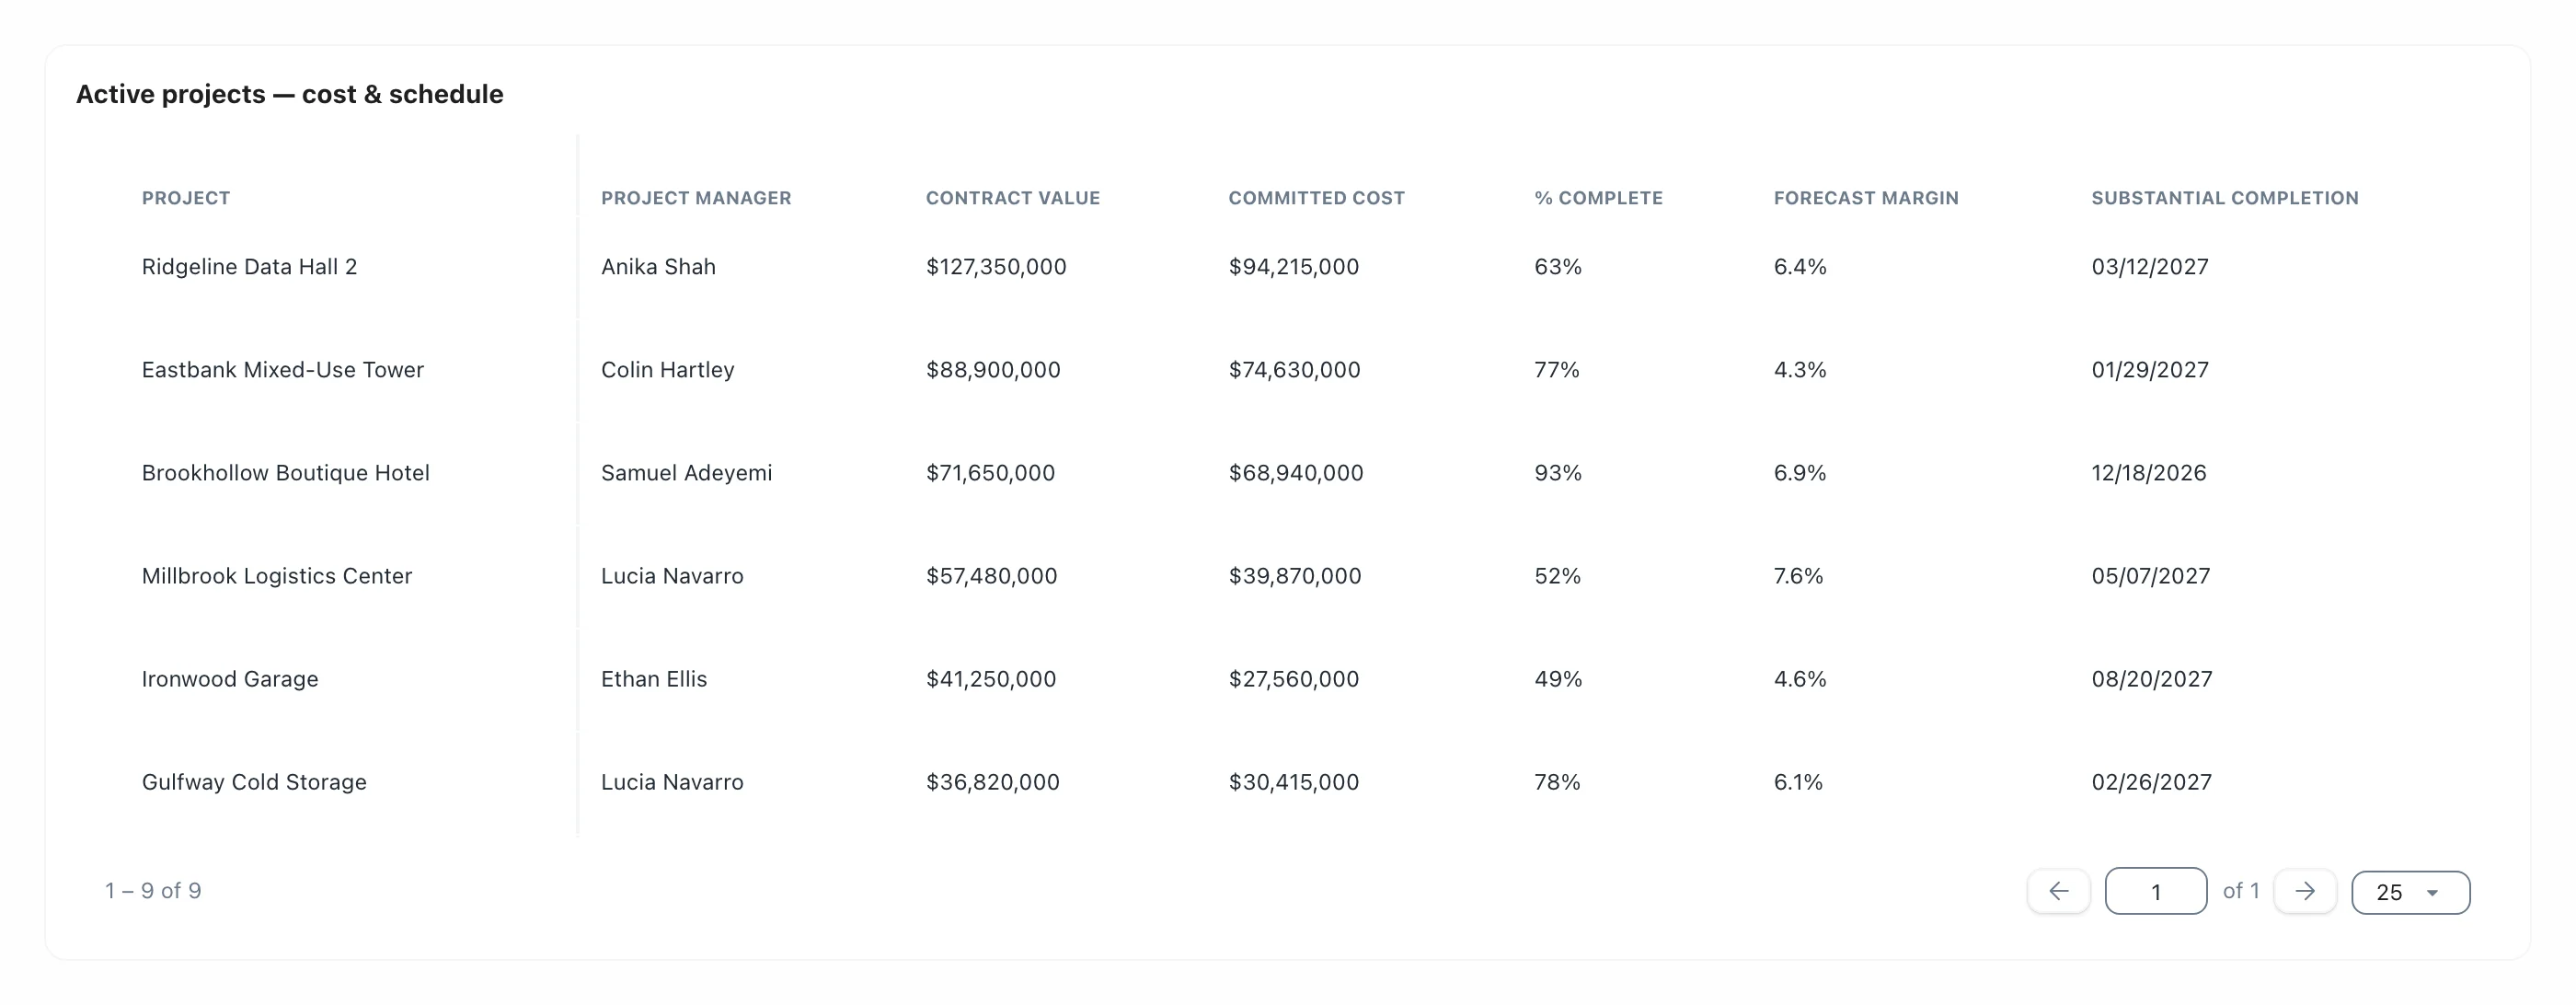
Portfolio cost report table with manager, contract value, committed cost, percent complete, forecast margin, and completion date
Tables & records
Table
Rows from any data type with calculated columns, filters, sorting, and totals. Your WIP schedule, without the spreadsheet.
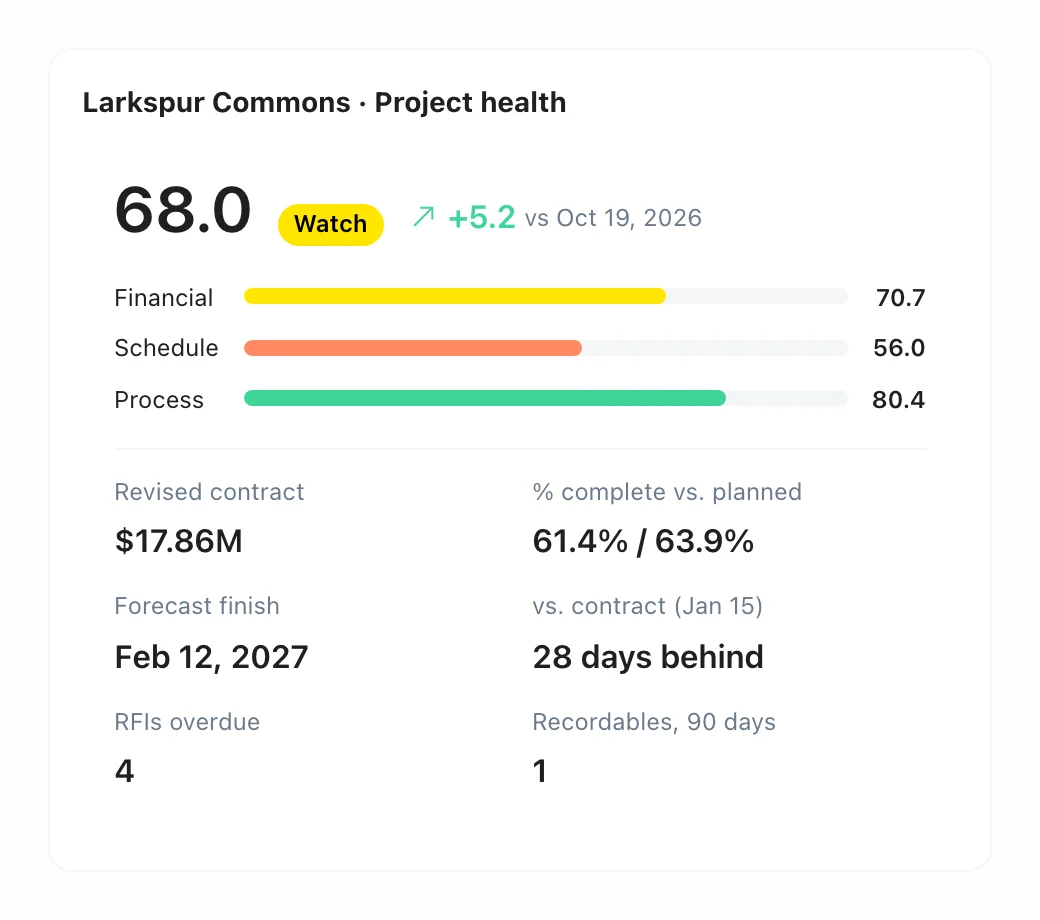
KPI card with a project health score, its financial, schedule, and process components, and key facts
Scores & KPIs
KPI card
A health score with its change, a bar for each component, and up to six facts underneath.
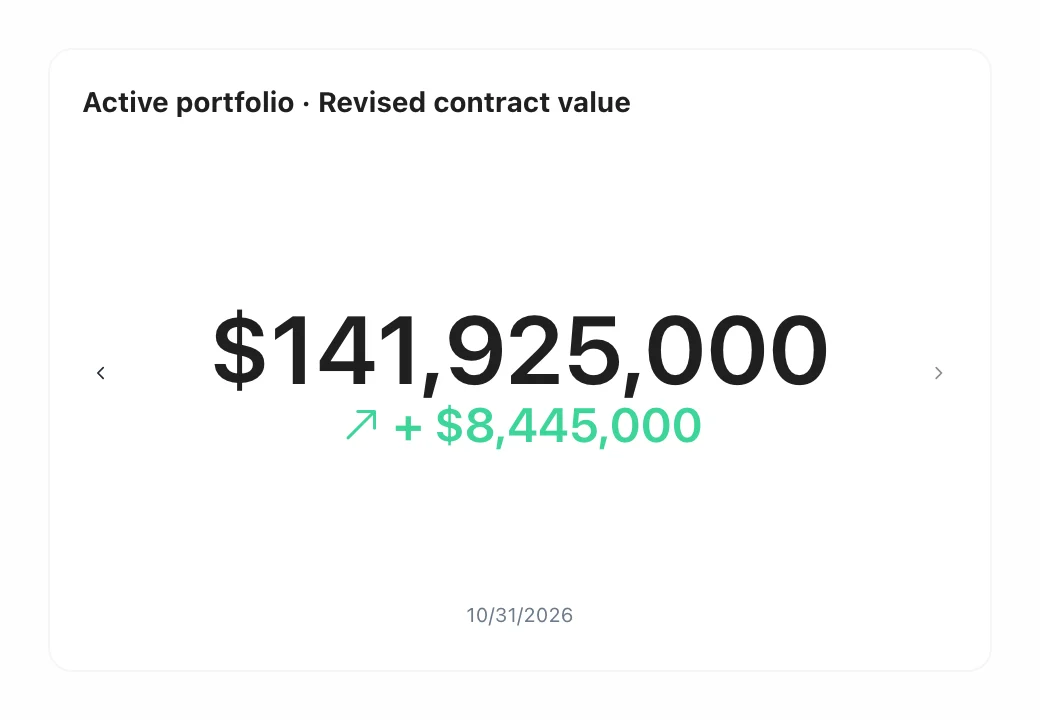
Single value widget showing the portfolio's revised contract value and its month-over-month change
Scores & KPIs
Single value
The headline number, with its change since last month and a step through its history.
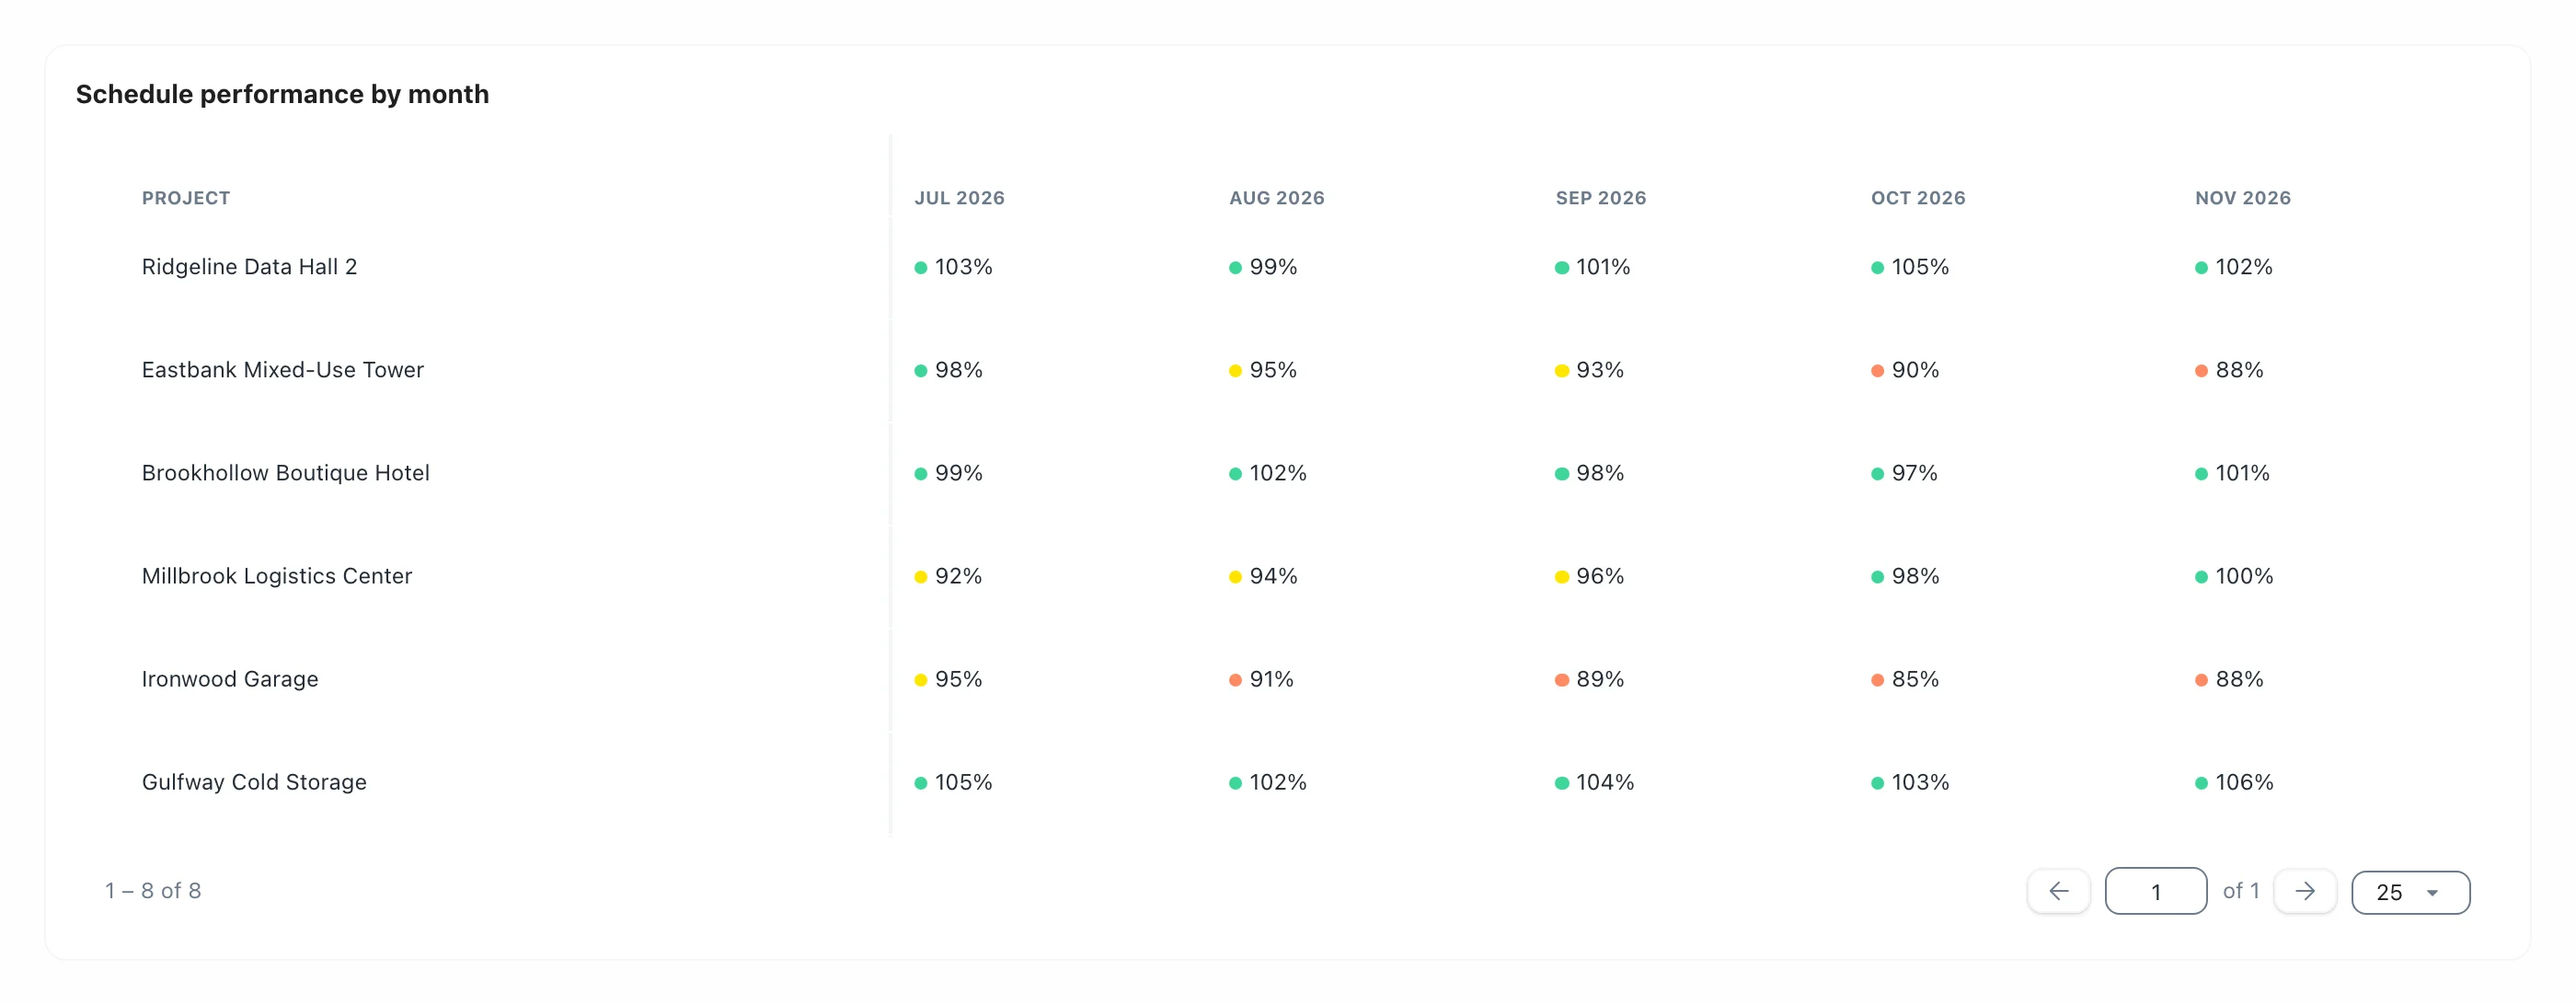
Score card grading eight projects month by month on schedule performance
Scores & KPIs
Score card
Every project graded month by month, or across your KPIs, in one color-coded grid. Slipping jobs jump out.
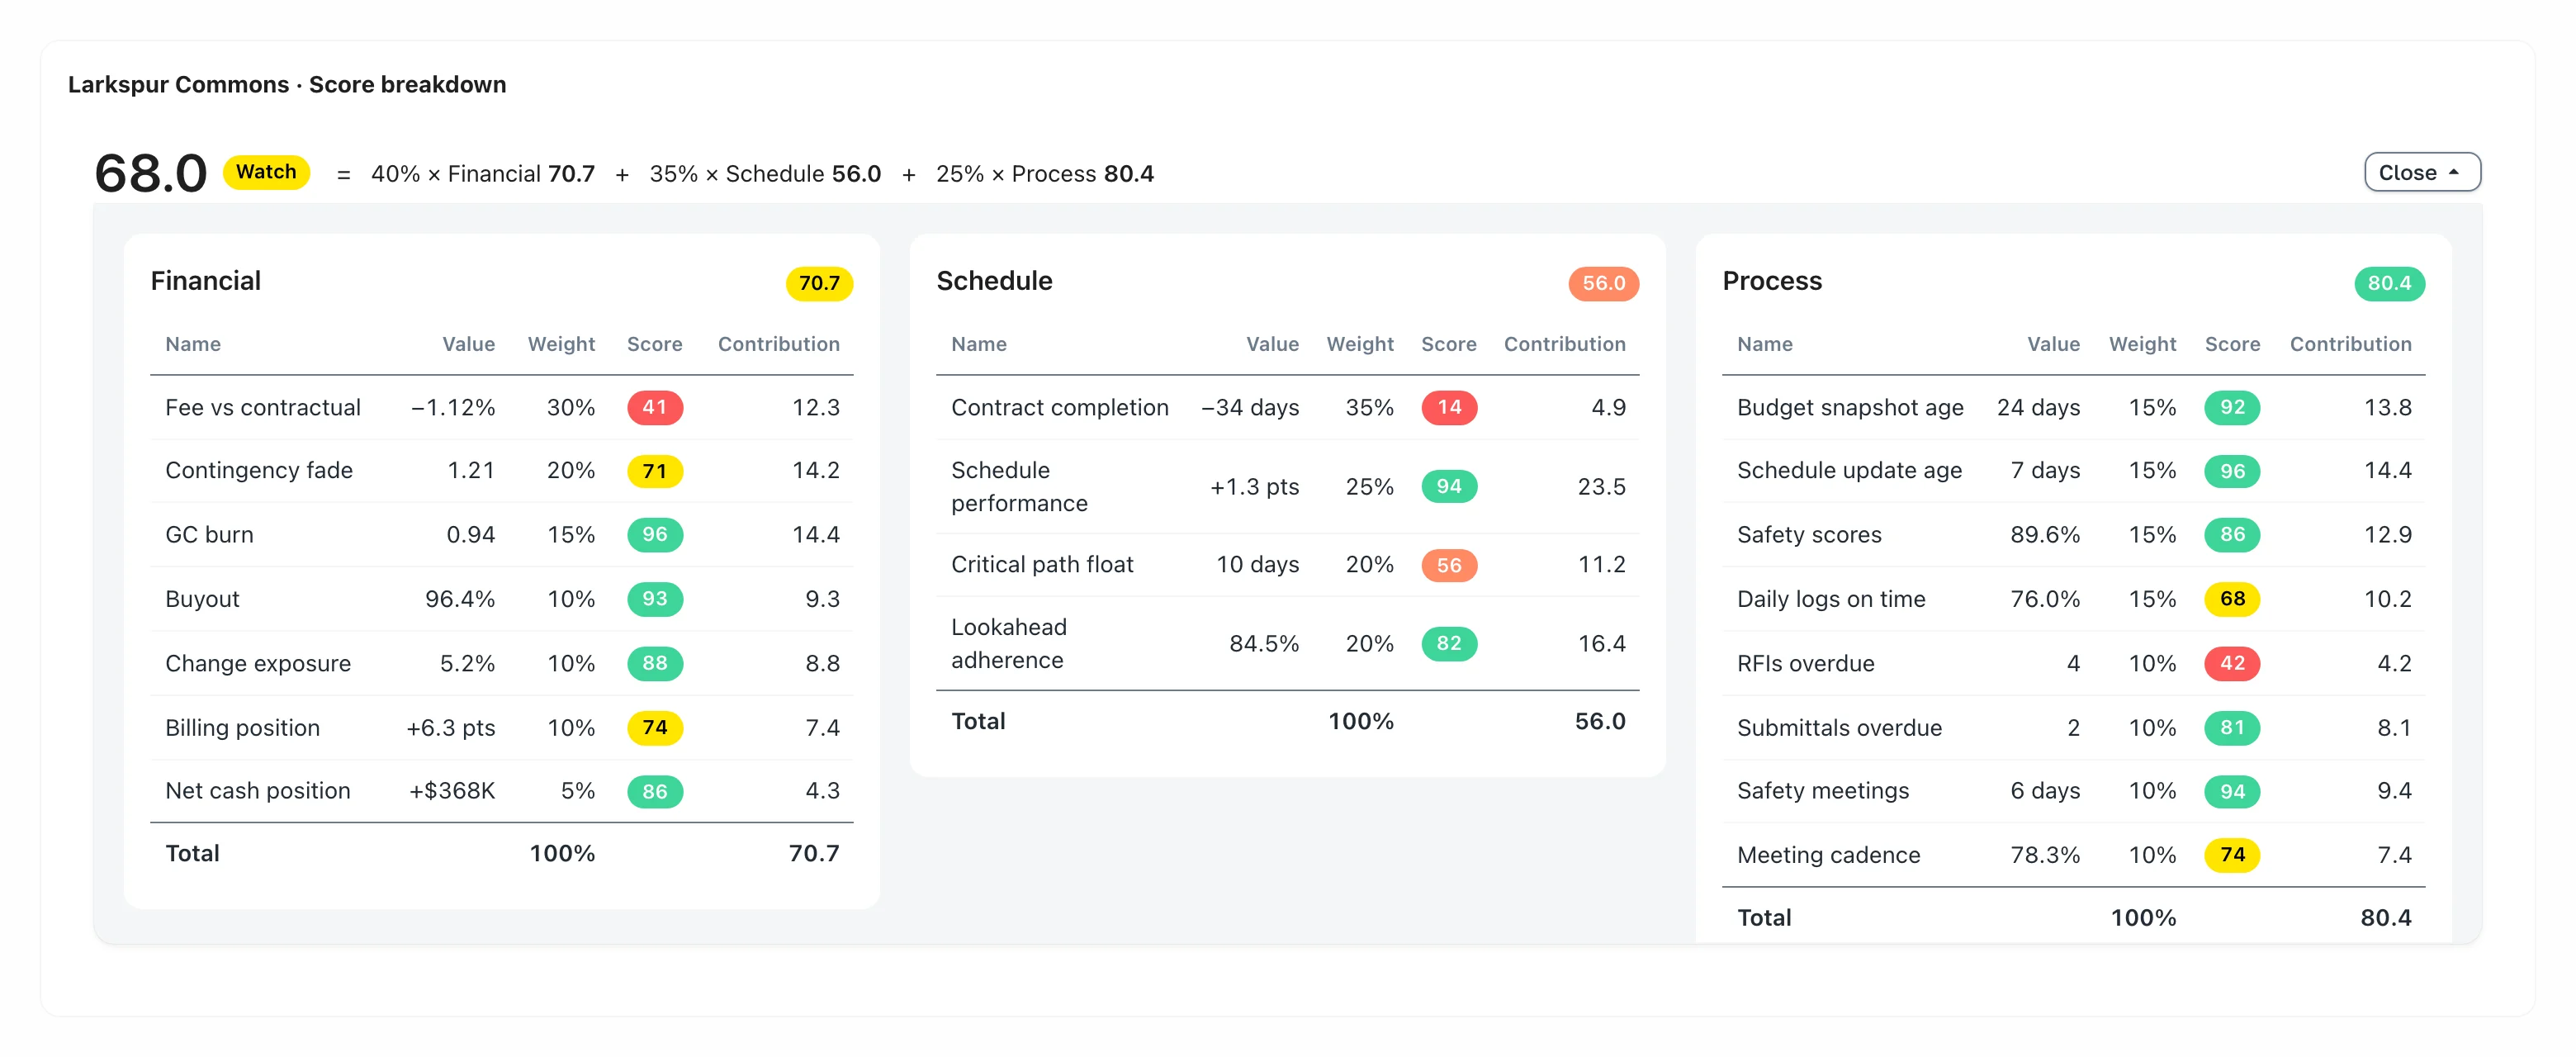
Score pillars breaking an overall project score into weighted financial, schedule, and process components
Scores & KPIs
Score pillars
How a score adds up, each component and its weight, so nobody argues about where the 73 came from.
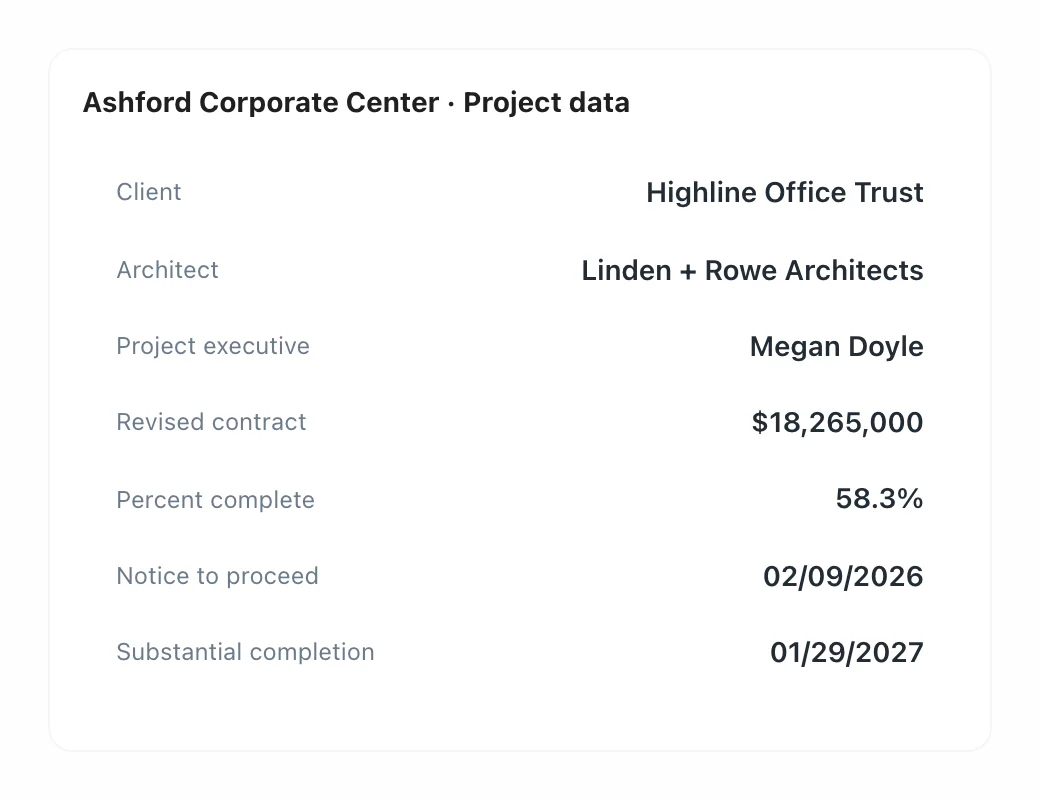
Project data card with a project's client, architect, executive, contract value, percent complete, and dates
Tables & records
Project data
A project's main details on one card, client, architect, executive, contract value, percent complete, and dates.
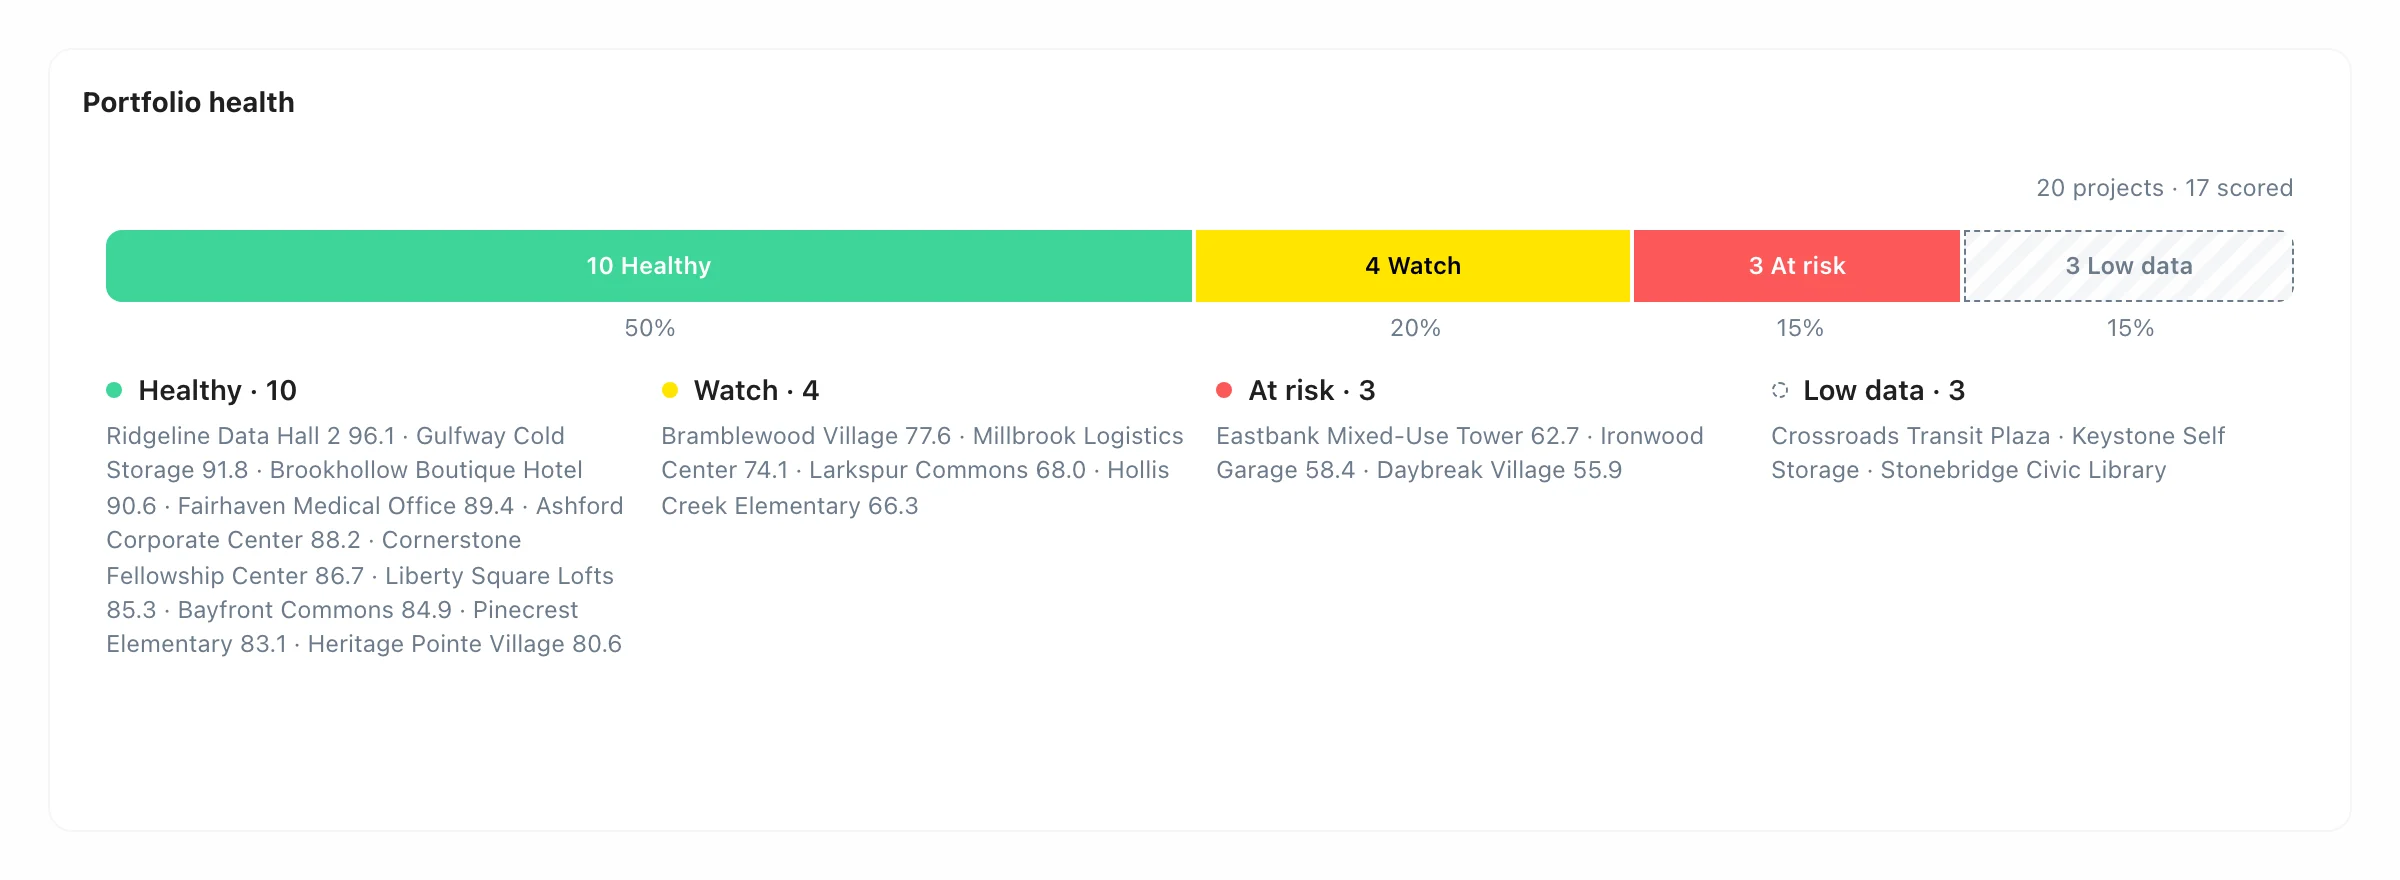
Segmented score bar splitting the portfolio into healthy, watch, at risk, and low data projects
Scores & KPIs
Segmented score bar
How the portfolio splits across score bands, healthy, watch, at risk, in a single bar with every project listed.
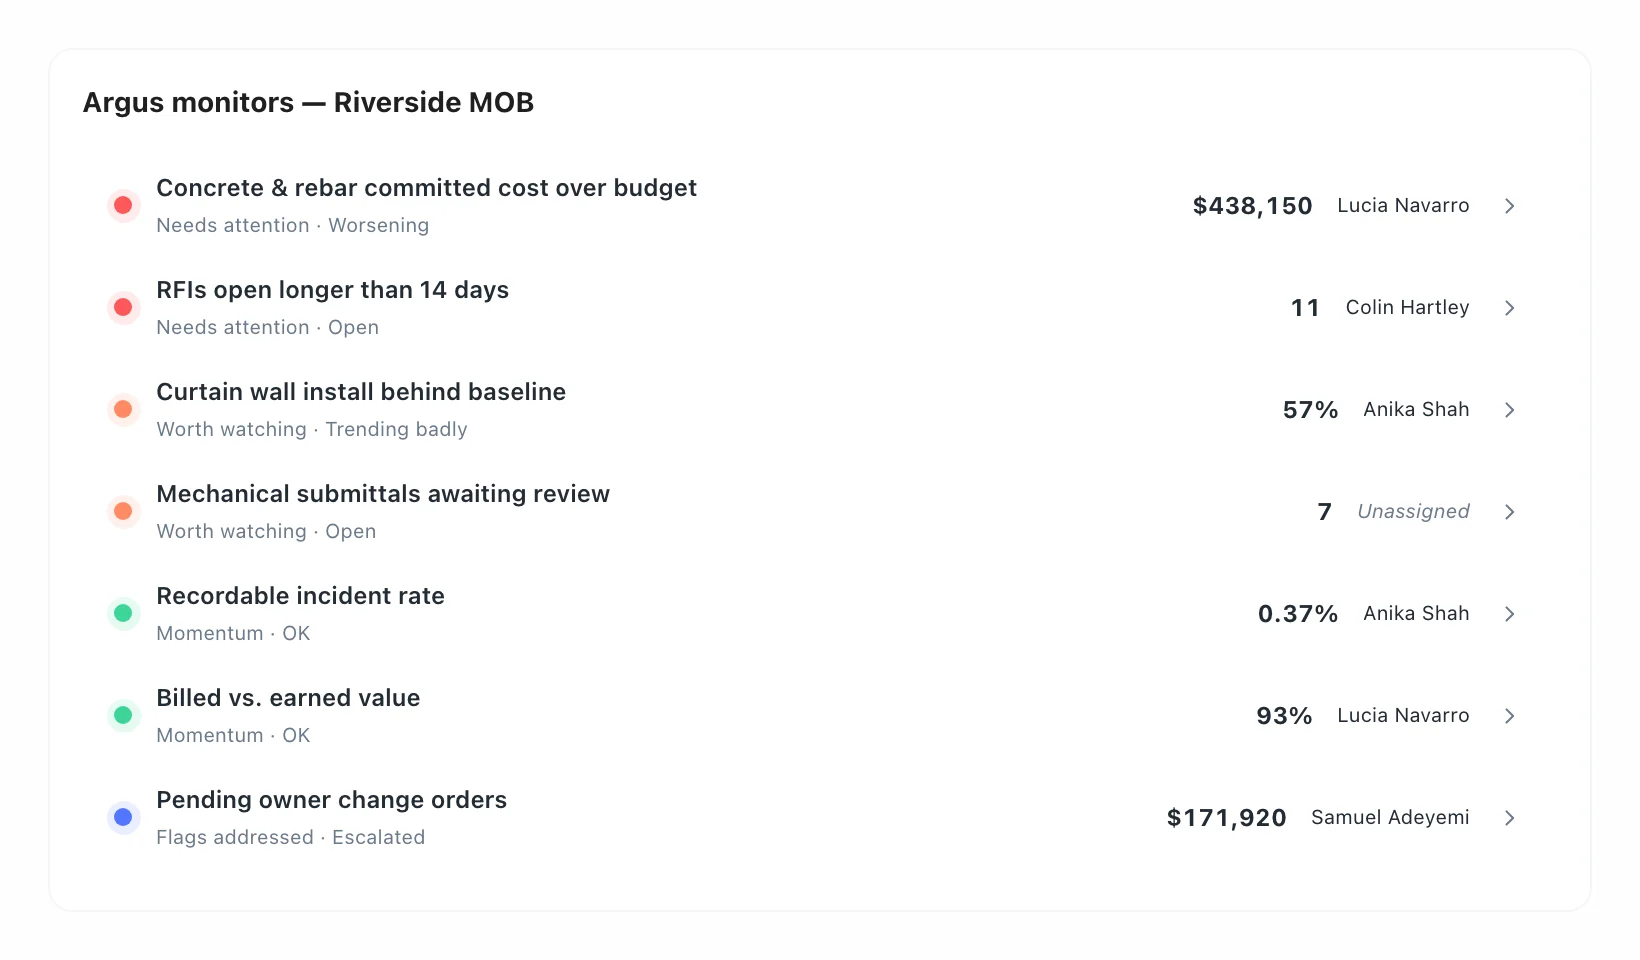
Argus monitors on one jobsite sorted by urgency, each with its headline figure and owner
Tables & records
Argus monitors
A project's Argus monitors sorted by urgency, each one a click away from the briefing.
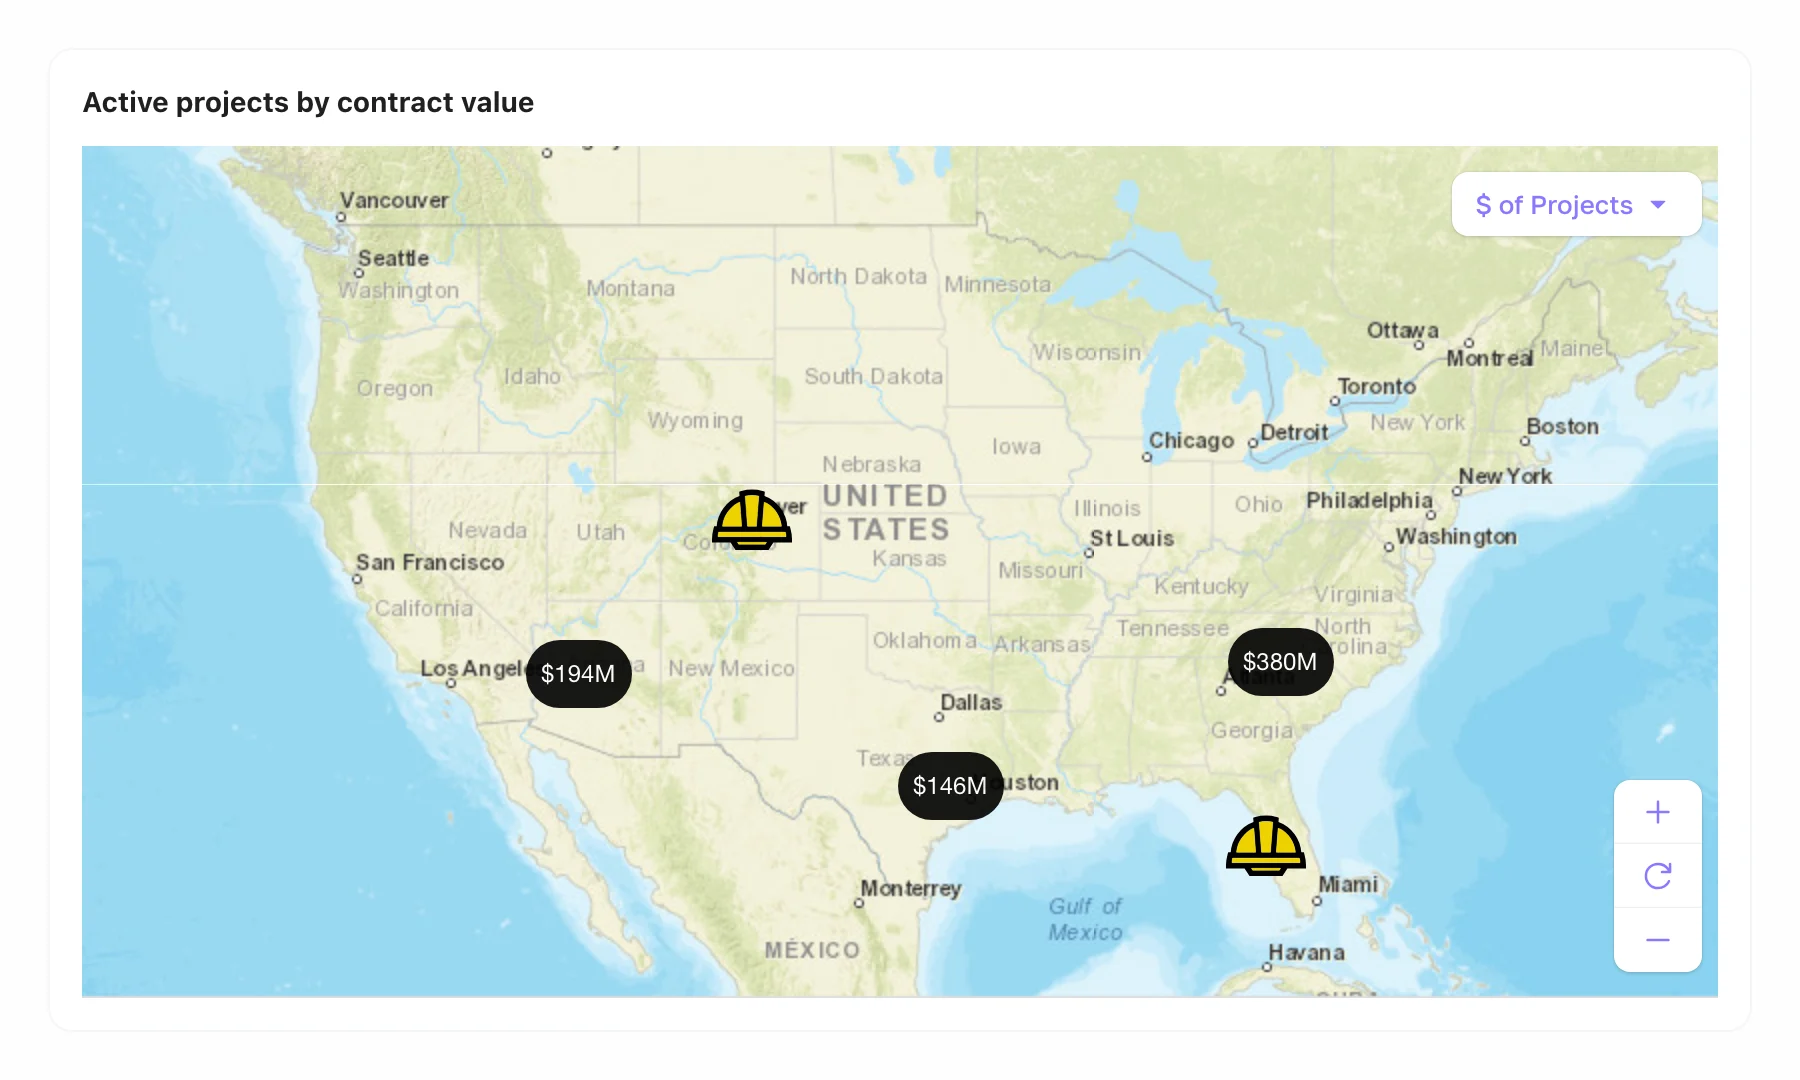
US map of active projects clustered by region and labelled with total contract value
Context
Map
Every job on a map, clustered by region with the contract value or project count on each cluster.
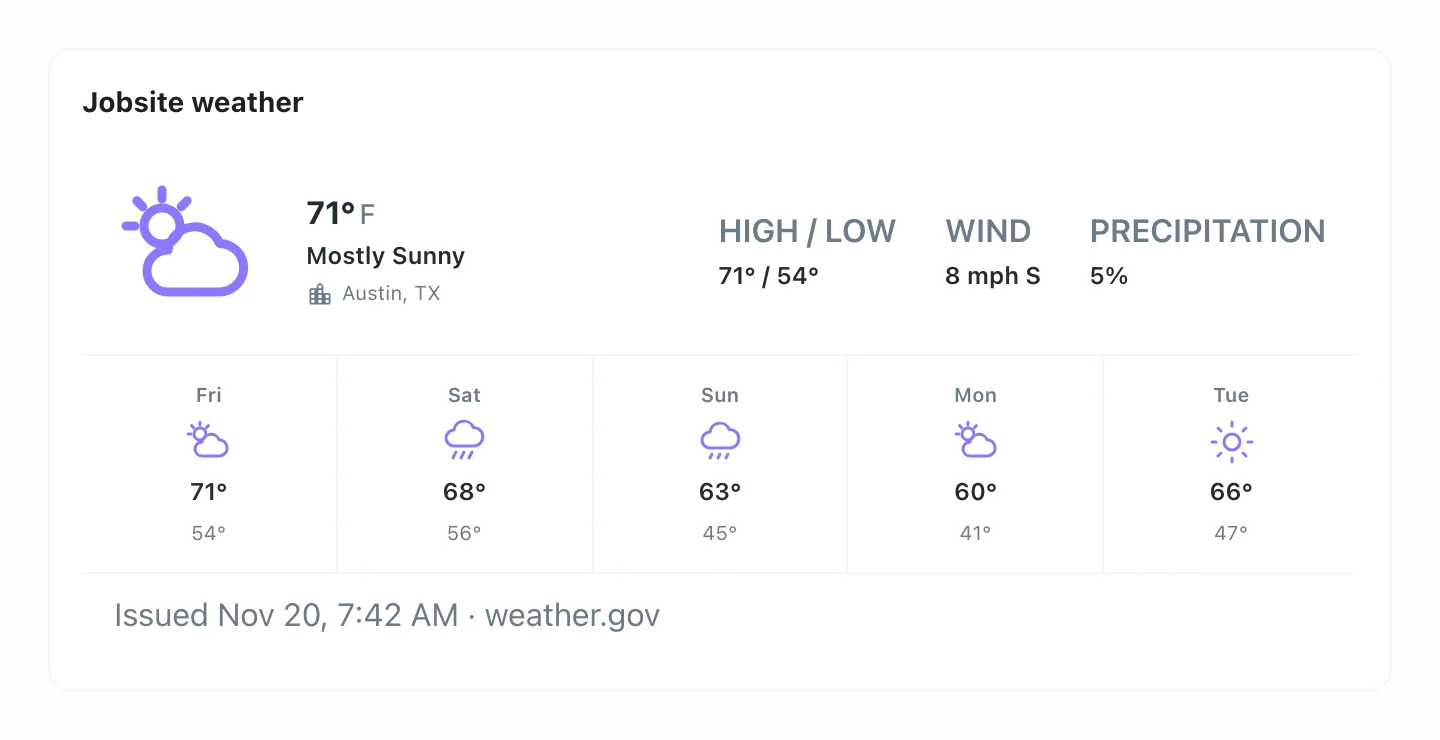
Weather widget with current conditions and a five-day forecast for a jobsite
Context
Weather
The jobsite forecast next to the schedule, so Thursday's pour doesn't surprise anyone.
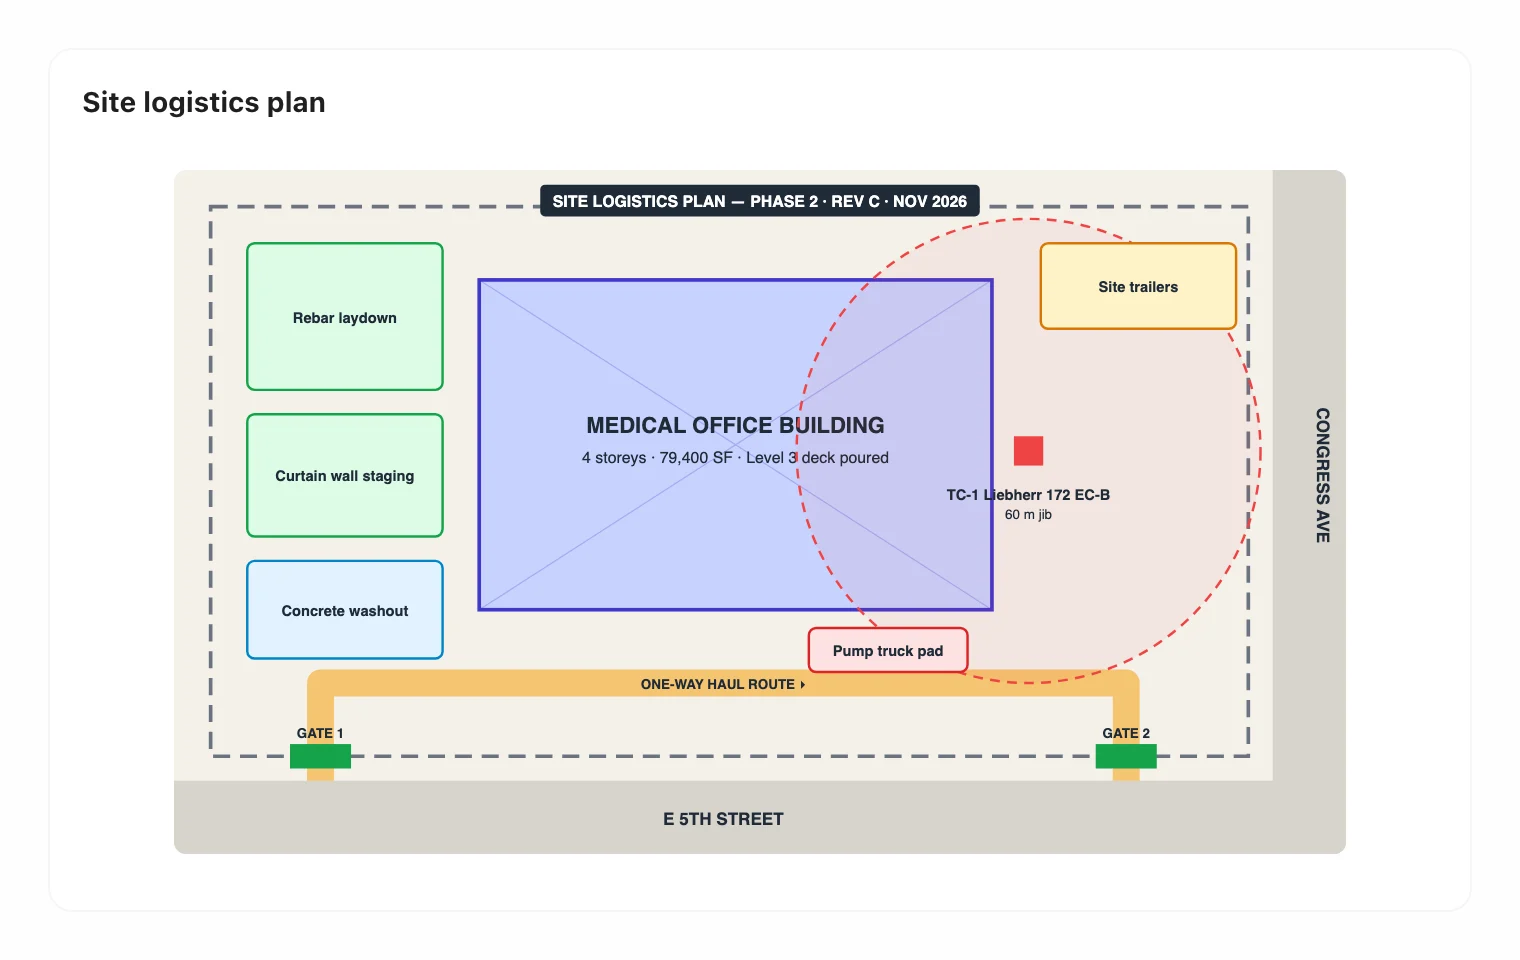
File widget showing a site logistics plan with crane, laydown yards, gates, and haul route
Context
File
Pin the site logistics plan, a photo, or a drawing, and it shows right on the dashboard.
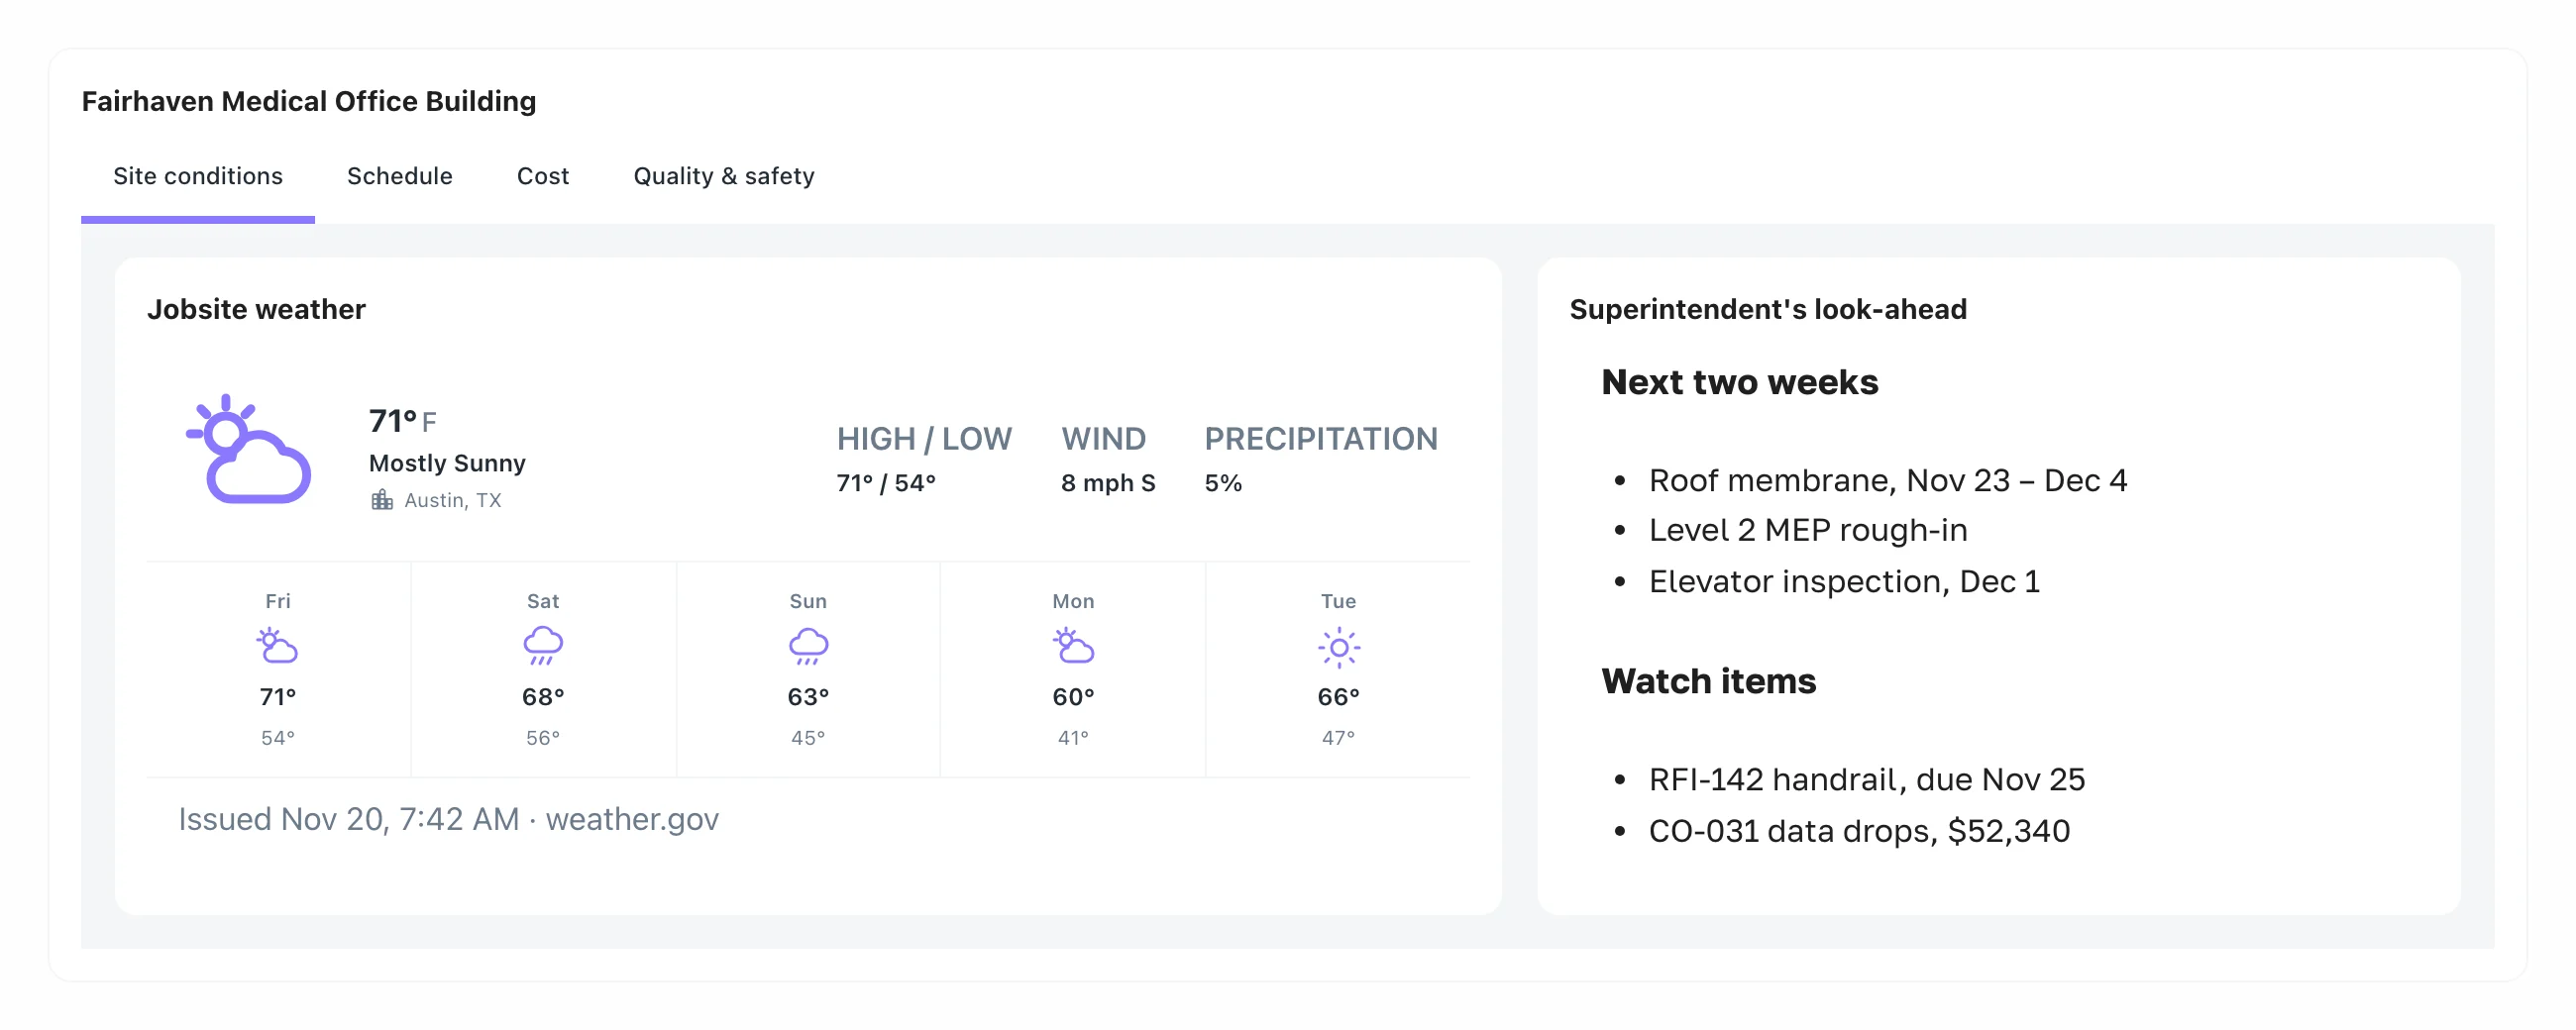
Section widget with tabs for site conditions, schedule, cost, and safety, holding a forecast and a look-ahead
Layout
Section
Group widgets under tabs, one dashboard, a page each for site conditions, schedule, cost, and safety.
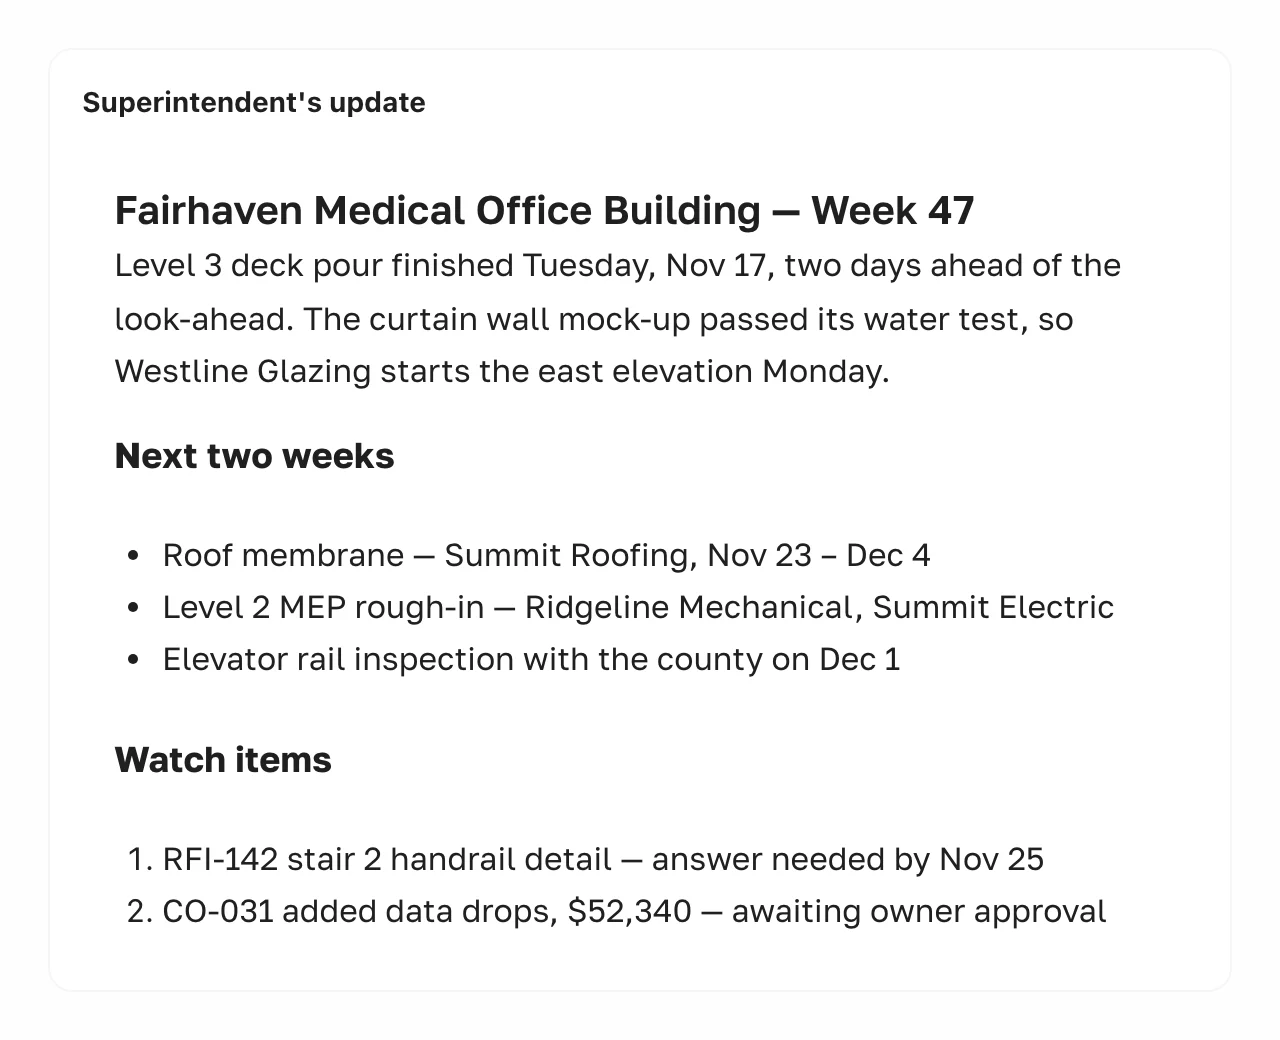
Text widget with a superintendent's weekly update and two-week look-ahead
Layout
Text
Notes, context, and the weekly update for whoever opens the dashboard next.

Every widget, the same rules

Name the question. There's a widget for it.

See a dashboard built live on your data.